Step-by-Step Guide to Using PSPP in Statistical Analysis
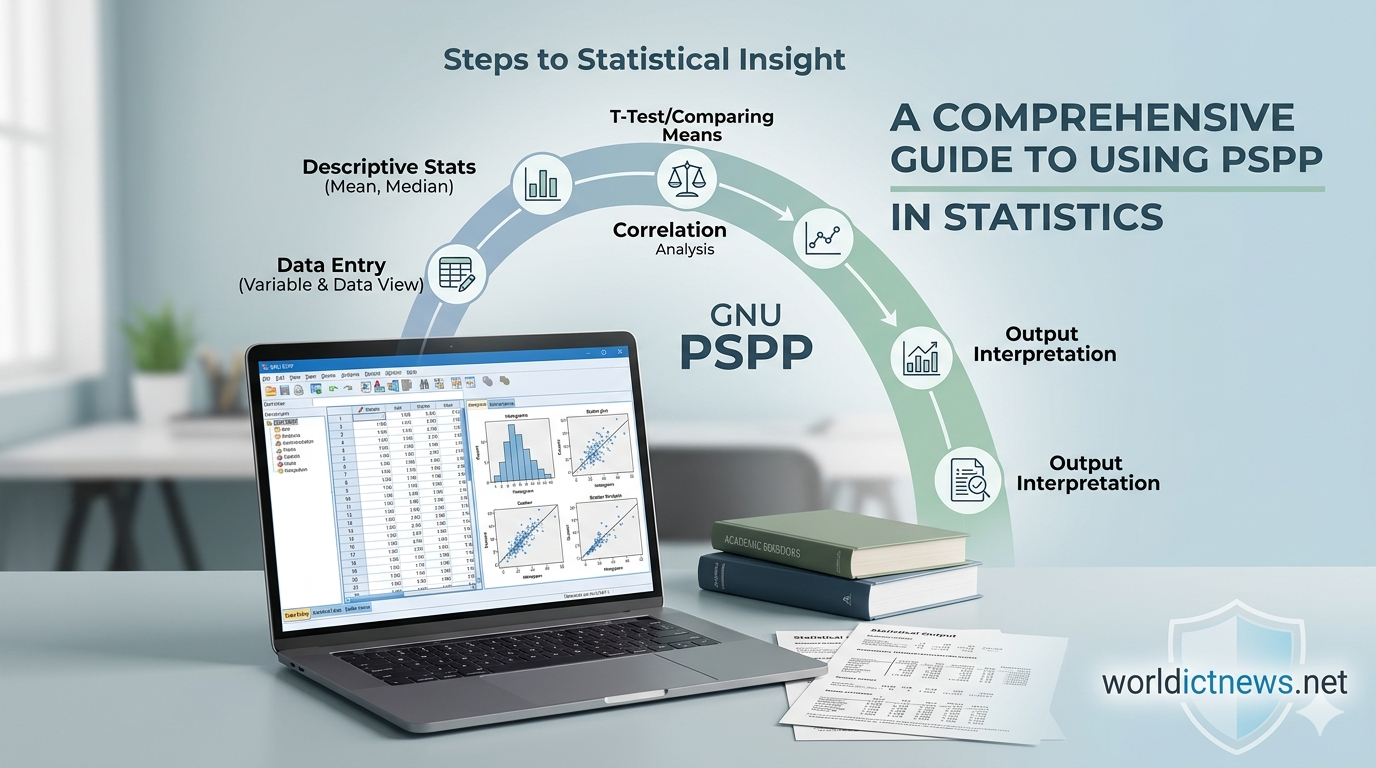
A Comprehensive, Step-by-Step Guide to Using PSPP in Statistical Analysis.
Data analysis is a core pillar of modern research, business intelligence, and academic study. While proprietary tools like IBM SPSS Statistics dominate the landscape, its licensing fees present a significant financial barrier for students, independent researchers, and non-profit organizations.
Fortunately, the GNU Project developed PSPP, a completely free, open-source alternative to SPSS. PSPP mirrors the user interface, syntax language, and data organization layout of SPSS, allowing users to transition seamlessly without a steep learning curve.
This comprehensive, step-by-step article serves as a practical manual for executing statistical analyses in PSPP. We will cover environment setup, data entry, descriptive statistics, and hypothesis testing—complete with real-world sample questions, step-by-step navigation instructions, and data output interpretations.
Understanding the PSPP Environment
When you open the PSPPire Graphical User Interface (GUI), you are presented with a primary workspace known as the Data Editor. Just like SPSS, this editor features two distinct views toggled at the bottom left-hand corner of the screen:
Variable View: The design canvas where you define your variables, configure data types (e.g., numeric, string, date), adjust width, specify decimal places, and assign descriptive labels or value codes.
Data View: A spreadsheet-like grid where the rows represent distinct observations (cases/participants) and the columns represent the variables defined in the Variable View.
Statistical analysis results do not appear in the Data Editor. Instead, running any statistical command automatically triggers a separate pop-up window known as the Output Viewer, where tables, metrics, and text summaries are formatted for review.
Section 1: Setting Up Variables and Entering Data
Before running any test, data must be structured correctly. Let us explore how to build a basic dataset from scratch using a hypothetical research scenario.
Scenario
A researcher wants to study the relationship between a person’s biological sex, their age, and their performance on a standard cognitive memory test (scored from 0 to 100).
Step-by-Step Dataset Construction
1. Define Variables in Variable View
Click the Variable View tab at the bottom left. Set up three distinct variables in successive rows:
Variable 1:
SexName:
SexType: Numeric
Decimals:
0Label: Biological Sex of Participant
Value Labels: Click the ellipsis (...) cell. Add
1 = Maleand2 = Female. This allows PSPP to process categorical data mathematically while displaying readable categories.Measure: Nominal
Variable 2:
AgeName:
AgeType: Numeric
Decimals:
0Label: Age in Years
Measure: Scale
Variable 3:
ScoreName:
ScoreType: Numeric
Decimals:
2Label: Cognitive Test Performance Score
Measure: Scale
2. Input Observations in Data View
Switch to the Data View tab. Enter the raw data points into rows like a conventional spreadsheet:
Row (Case) | Sex | Age | Score |
|---|---|---|---|
1 | 1 | 21 | 85.50 |
2 | 2 | 24 | 92.00 |
3 | 1 | 22 | 78.00 |
4 | 2 | 19 | 88.50 |
5 | 1 | 35 | 65.00 |
6 | 2 | 29 | 95.00 |
7 | 2 | 31 | 89.00 |
8 | 1 | 26 | 72.50 |
Section 2: Descriptive Statistics
Descriptive statistics summarize and describe the core characteristics of a dataset. They give analysts a bird's-eye view of central tendencies and data distributions.
Question 1
What are the mean, median, standard deviation, and range of the respondents’ ages and cognitive test scores in our sample?
Step-by-Step PSPP Execution
Navigate to the top menu bar and click Analyze
Descriptive Statistics
Frequencies.
A dialog box will appear. Select
Age in Years [Age]andCognitive Test Performance Score [Score]from the left variable list.Click the arrow button to move them into the Variable(s) column on the right.
Click the Statistics button at the bottom of the dialog box.
Check the boxes for Mean, Median, Std deviation, Minimum, and Maximum.
Click Continue, and then click OK.
Output Interpretation
The Output Viewer will generate a summary table resembling the following:
Metric | Age in Years | Cognitive Test Performance Score |
|---|---|---|
N (Valid) | 8 | 8 |
Mean | 25.88 | 83.19 |
Median | 25.00 | 87.00 |
Std. Deviation | 5.25 | 10.37 |
Minimum | 19 | 65.00 |
Maximum | 35 | 95.00 |
Analysis conclusion: The average age of our sample is 25.88 years (with a standard deviation of 5.25), ranging from 19 to 35. The average performance score sits at 83.19 points, showing a relatively tight spread (SD = 10.37) around a median performance of 87.00.
Section 3: Comparing Means (Independent Samples t-Test)
An independent samples t-test compares the mean scores of two unrelated groups to determine whether there is statistical evidence that the associated population means are significantly different.
Question 2
Is there a statistically significant difference in cognitive test scores between male and female participants?
Step-by-Step PSPP Execution
Go to the top menu and select Analyze
Compare Means
Independent-Samples T Test.
Select
Cognitive Test Performance Score [Score]and move it into the Test Variable(s) field.Select
Biological Sex of Participant [Sex]and move it into the Grouping Variable field.Click Define Groups. Enter
1for Group 1 (representing Males) and2for Group 2 (representing Females).Click Continue, then click OK.
Output Interpretation
The output reveals two critical tables: Group Statistics and the Independent Samples Test.
Group Statistics Table Summary:
Male (N=4): Mean = 75.25; Std. Deviation = 9.35
Female (N=4): Mean = 91.13; Std. Deviation = 2.95
Independent Samples Test Table Summary:
Levene's Test for Equality of Variances: Sig. (p-value) < 0.05 (Variances are unequal, meaning we must read the "Equal variances not assumed" row).
t-value: -3.22
df (Degrees of Freedom): 3.63
Sig. (2-tailed): 0.038
Analysis conclusion: Because the 2-tailed significance value (p = 0.038) is less than our standard alpha level of 0.05, we reject the null hypothesis. There is a statistically significant difference between groups: female participants scored significantly higher on the cognitive test than male participants.
Section 4: Examining Relationships (Pearson Correlation)
Correlation testing determines the strength and direction of a linear relationship between two continuous variables.
Question 3
Does an individual's age correlate significantly with their cognitive test score?
Step-by-Step PSPP Execution
Go to the top menu and click Analyze
Bivariate Correlation.
Select both
AgeandScorefrom the left list.Click the arrow button to move them into the Variables box.
Ensure the Pearson checkbox is marked under Correlation Coefficients.
Keep Two-tailed significance selected.
Click OK.
Output Interpretation
PSPP outputs a symmetrical correlation matrix table:
Variable | Age | Score | |
|---|---|---|---|
Age | Pearson Correlation | 1.00 | -0.841 |
Score | Pearson Correlation | -0.841 | 1.00 |
Analysis conclusion: The Pearson correlation coefficient (
) between Age and Score is -0.841. The significance value is 0.009, which is well below 0.05. This reveals a strong negative correlation that is statistically highly significant. As age increases, cognitive performance test scores tend to decrease significantly.
Section 5: Categorical Data Analysis (Chi-Square Test of Independence)
When both variables are nominal or ordinal (categorical), researchers use the Chi-Square test of independence to assess if the variables are associated with one another.
Scenario Expansion
Imagine expanding the sample to include a new categorical variable: Pass_Fail (1 = Pass, 2 = Fail). We want to know if passing rates differ across biological sexes.
Question 4
Is there a significant association between biological sex and the likelihood of passing or failing the cognitive evaluation?
Step-by-Step PSPP Execution
Go to the top menu and click Analyze
Descriptive Statistics
Crosstabs.
Move
Sexinto the Row(s) field.Move
Pass_Failinto the Column(s) field.Click the Statistics button on the bottom right of the Crosstabs window.
Check the box for Chi-square.
Click Continue, and then click OK.
Output Interpretation
The Output viewer produces a contingency table and a Chi-Square Tests diagnostic panel.
Look closely at the Pearson Chi-Square row.
Focus on the Asymp. Sig. (2-sided) column.
Analysis conclusion: If the asymptotic significance value is greater than 0.05, you fail to reject the null hypothesis, concluding that biological sex is completely independent of pass/fail rates. Conversely, a value below 0.05 means sex is significantly associated with passing outcomes.
Summary Comparison: PSPP vs. SPSS
To understand when to use PSPP over commercial choices, review this operational breakdown:
Feature Dimension | GNU PSPP | IBM SPSS Statistics |
|---|---|---|
Licensing Cost | Completely Free (Open-Source) | High Premium Commercial Fee |
Interface Setup | Dual-view layout (Variable & Data View) | Dual-view layout (Variable & Data View) |
Core Functions | Frequencies, T-Tests, ANOVA, Linear Regression | Advanced Predictive Analysis, Neural Networks |
Platform Size | Lightweight, runs efficiently on old hardware | Heavy download size, resource-demanding |
Syntax Support | Interprets SPSS command language directly | Native standard syntax language environment |
Conclusion
PSPP is a powerful, lightweight, and accessible tool for anyone conducting statistical research without a massive software budget. By mastering variable definition, data entry, and core analytical paths—such as descriptives, independent t-tests, Pearson correlations, and cross-tabulations—you can answer complex research questions and extract deep insights from empirical data.
Did you find this ICT insight helpful?