Integrating Autopsy and Volatility for Advanced RAM Analysis
Digital Forensics: Integrating Autopsy and Volatility for Advanced RAM Analysis.
Introduction
In modern cybersecurity incident response, volatile memory (RAM) is a critical source of evidence. When a system is compromised, attackers often deploy sophisticated, fileless malware that resides exclusively in memory, leaving little to no trace on the physical hard drive. Traditional disk-based forensics can completely miss these active connections, injected code pieces, and hidden processes.
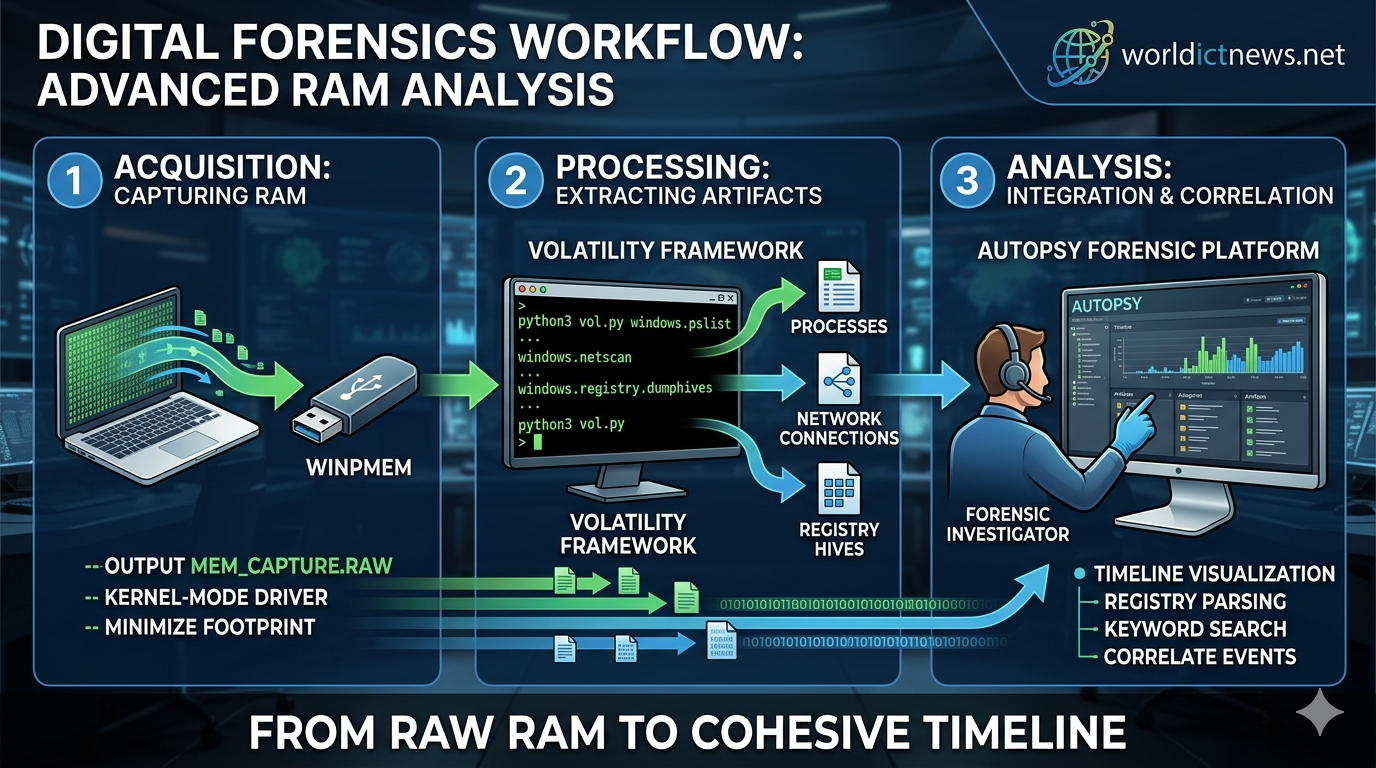
To uncover these advanced threats, digital forensic investigators rely on specialized tools. This guide covers a powerful open-source forensic workflow: capturing physical memory using Winpmem, analyzing that memory image with the Volatility Framework, and integrating the results into Autopsy for comprehensive, timeline-based case investigation.
1. The Critical Role of Volatile Memory Forensics
When an incident response team arrives at a compromised machine, they must prioritize data collection based on the Order of Volatility. Data in the CPU cache, routing tables, and RAM disappears the moment a machine is powered down or rebooted.
Why RAM Analysis Matters
Active Network Connections: Captures real-time sockets, listening ports, and remote IP addresses established by reverse shells or Command and Control (C2) servers.
Decrypted Credentials: Reveals passwords, encryption keys, and session tokens stored in plaintext within memory buffers.
Unpacked Malware: Code that is heavily obfuscated or encrypted on disk must unpack itself into RAM to execute, making it fully visible to memory analysis.
Loaded Drivers and Modules: Pinpoints rootkits and malicious Dynamic Link Libraries (DLLs) injected into legitimate system infrastructure.
2. Phase 1: Capturing RAM with Winpmem
Before you can analyze memory, you must capture it cleanly. Winpmem is a highly reliable, open-source memory acquisition tool for Windows environments. It uses a kernel-mode driver to map physical memory and write it out to a file (typically with a .raw, .dmp, or .img extension).
Step-by-Step Acquisition Procedure
Prepare the Forensic Drive: Download the latest executable version of Winpmem. Always run Winpmem from an external, write-protected USB drive or a secure network share to avoid overwriting crucial evidence in the subject machine's RAM.
Open an Elevated Terminal: Click the Start menu, search for
cmdorPowerShell, right-click, and select Run as Administrator.Navigate to the Tool Location: Change directories to your external forensic drive:
cmd
cd D:\ForensicTools\Use code with caution.
Execute the Capture Command: Run Winpmem, specifying the output format and target destination. Use the standard raw output format for maximum compatibility:
cmd
winpmem_3.3.rc3.exe --output C:\cases\mem_capture.raw --FORMAT raw
Use code with caution.
Note: Ensure the destination drive has enough free space to match or exceed the target machine's physical RAM capacity (e.g., a 16GB RAM system requires a minimum of 16GB of storage space).
Calculate the Hash Value: Once the extraction finishes, immediately generate a cryptographic hash (SHA-256) of the generated image file to ensure chain of custody validation:
cmd
certutil -hashfile C:\cases\mem_capture.raw SHA256
Use code with caution.
Record this hash in your forensic notebook.
3. Phase 2: Processing the Memory Image with Volatility
Once you have securely collected the .raw memory file, move it to your dedicated forensic workstation. Volatility is the industry standard framework for extracting structured information from raw memory dumps.
While Volatility can isolate malware directly, processing raw memory listings in text form can make it difficult to visualize timelines. To solve this, we will configure Volatility to parse out core system files, which we will later import into Autopsy for deeper analysis.
Essential Volatility Extraction Commands
Depending on whether you use Volatility 2 or Volatility 3, the syntax will vary slightly. Below are standard commands used to extract key forensic artifacts:
Identifying Rogue Processes
Look for suspicious parental architectures, unfamiliar process names, or hidden tasks:
bash
# Volatility 3
python3 vol.py -f /cases/mem_capture.raw windows.pslist
python3 vol.py -f /cases/mem_capture.raw windows.pstree
Use code with caution.
Spotting Active Network Infrastructure
Identify active or closed connections linking back to external malicious infrastructures:
bash
# Volatility 3
python3 vol.py -f /cases/mem_capture.raw windows.netscan
Use code with caution.
Extracting Injected Code Blocks and DLLs
Uncover dynamic code blocks injected into legitimate background processes like svchost.exe or explorer.exe:
bash
# Volatility 3
python3 vol.py -f /cases/mem_capture.raw windows.malfind
Use code with caution.
Exporting Registry Hives for Autopsy Integration
To build a cohesive timeline inside Autopsy, extract the primary Windows Registry hives hidden inside the RAM dump:
bash
# Create an output directory for the hives
mkdir /cases/extracted_hives
# Dump the registry hives using Volatility
python3 vol.py -f /cases/mem_capture.raw -o /cases/extracted_hives windows.registry.dumphives
Use code with caution.
4. Phase 3: Integrating and Analyzing in Autopsy
Autopsy is an intuitive, GUI-based digital forensics platform. While it is primarily used for hard drive images, its ingestion engine excels at compiling extracted registry structures, configuration files, and timelines into a centralized, searchable database.
+---+ +--+ +--+
| Winpmem (RAM) | ---> | Volatility Engine | ---> | Autopsy Workspace |
| .raw Memory Dump | | Artifact Extraction| | Comprehensive Case |
+--+ +--+ +--+
Step 1: Create a New Forensic Case
Launch Autopsy.
Click New Case.
Enter a structured Case Name (e.g.,
Incident_Response_2026_001) and specify the base directory where case metadata will live. Click Next.Provide your investigator credentials, case number, and notes. Click Finish.
Step 2: Add Extracted Memory Data Sources
Instead of importing the entire 16GB raw RAM file directly into Autopsy—which can slow down processing times—import the highly concentrated files, registry hives, and event logs extracted during Phase 2.
Select Logical Files as the data source type, then click Next.
Click Add and point the path explorer directly to your
/cases/extracted_hivesfolder containing your Volatility output.Click Next to proceed to the Ingest Modules window.
Step 3: Configure Ingest Modules
Ingest modules are automated analysis tools that scan your imported files for evidence. For memory-extracted files, configure the following modules:
[X] File Type Identifier (Detects spoofed file extensions)
[X] Extension Mismatch Detector
[X] Keyword Search (Input C2 IP addresses, suspicious domains, or known hacker aliases)
[X] RegRipper (Automates parsing of the memory-extracted Registry hives)
Click Finish to allow the background processing engine to start analyzing the data.
5. Correlating the Evidence: Finding the Needle in the Haystack
With all your data organized inside Autopsy, you can now connect the dots across your various data sources to reconstruct the attack.
1. Reconstructing the Attack Timeline
Click the Timeline tool in the top Autopsy tool ribbon. This aggregates all data points into an interactive bar graph. You can filter the view to look at events that occurred around the exact minute the initial security alert triggered. This lets you see which registry keys were modified and which processes were spawned in memory right as the compromise happened.
2. Finding Artifacts with RegRipper
Navigate to the Results tree on the left sidebar and expand Extracted Data. Look for findings categorized by the RegRipper module:
UserAssist Keys: Shows exactly which programs the attacker executed on the system, along with the precise execution timestamps.
RunKeys: Uncovers any persistence mechanisms the malware added to the registry to ensure it restarts automatically if the computer reboots.
3. Reviewing Keyword Search Hits
If your network monitoring tools flagged a suspicious destination IP address, look at the Keyword Hits folder in Autopsy. This shows you exactly where that IP address appears within the memory dump, whether it's embedded inside process strings, network buffers, or browser activity records.
6. Common Pitfalls and Mitigation Strategies
Smearing the Memory Image: Running any tool on a live system alters its memory configuration slightly. Minimize this footprint by using lightweight command-line configurations for Winpmem and keeping all output paths pointed away from the local drive.
Using Mismatched Profile Architectures: If you are using Volatility 2, selecting an incorrect operating system profile can lead to corrupted listings or failed parses. Always verify the target OS version using the
windows.infomodule before running deep artifact extraction commands.High Memory Consumption During Analysis: Running Autopsy ingestion while simultaneously extracting artifacts with Volatility can easily overwhelm a standard forensic workstation. For stable performance, allocate a minimum of 32GB of RAM to your analysis workstation and assign specific CPU core limits within Autopsy's options menu.
Conclusion
Combining the strengths of Winpmem, Volatility, and Autopsy creates a comprehensive open-source workflow for volatile memory forensics. Winpmem safely captures evidence directly from RAM, Volatility decodes complex memory structures into accessible files, and Autopsy integrates everything into a searchable, timeline-driven case workspace.
Using this structured approach, incident responders can thoroughly document threat actor activities, identify sophisticated fileless malware strains, and build resilient, audit-ready forensic cases.
Did you find this ICT insight helpful?