Mastering Data Manipulation and Aggregation in Data Science
Foundations of Data Science: Mastering Data Manipulation and Aggregation
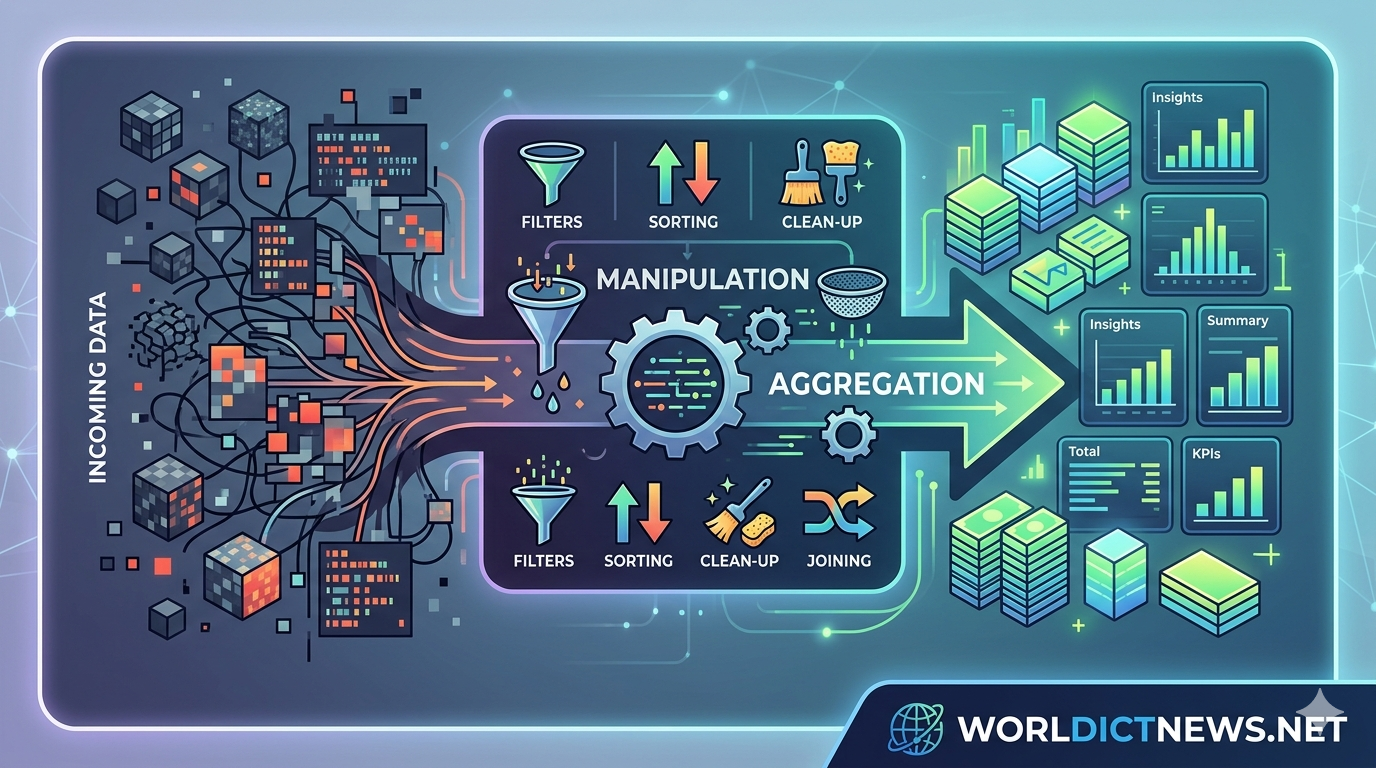
In the era of big data, information is often described as the new oil. However, just like crude oil, raw data is rarely useful in its extracted state. It is frequently messy, unstructured, incomplete, and scattered across disparate systems. To transform this raw resource into actionable intelligence, data scientists rely on two fundamental processes: data manipulation and data aggregation.
Together, these techniques form the bedrock of data preprocessing—a phase that experts estimate consumes up to 80% of a data scientist's time. This article explores the core concepts, methodologies, tools, and real-world applications of data manipulation and aggregation, demonstrating how they turn chaotic datasets into structural foundations for machine learning and business intelligence.
1. Understanding Data Manipulation: The Art of Cleaning and Shaping
Data manipulation involves modifying, structuring, and cleaning data to make it more readable, accurate, and optimized for analysis. It is not about altering the truth within the data, but rather about organizing it so that analytical models can interpret it correctly.
Handling Missing Data
Real-world data is plagued by missing values, often represented as NaN (Not a Number) or Null. Ignoring these gaps can skew statistical analyses or cause machine learning algorithms to fail. Data manipulation provides two primary strategies:
Deletion: Removing rows or columns with missing values. This is acceptable if the missing data is minimal, but risks losing valuable information if the gaps are widespread.
Imputation: Filling in missing values using statistical metrics (such as the mean, median, or mode) or predictive algorithms (like K-Nearest Neighbors). For instance, a missing stock price might be imputed using the average price of that asset over the trailing 30 days.
Type Conversion and Standardization
Data often arrives in incompatible formats. A date column might be read as text strings, or numerical values might include currency symbols (e.g., "$150"). Data manipulation ensures structural uniformity:
Casting Data Types: Converting text strings into proper datetime objects or floats to enable mathematical operations.
String Cleaning: Stripping whitespace, converting text to lowercase, and removing punctuation to ensure consistency (e.g., matching "Apple ", "apple", and "APPLE" into a single entity).
Filtering and Sorting
Analyses are rarely performed on entire monolithic datasets simultaneously. Filtering allows data scientists to isolate specific subsets based on logical conditions—such as extracting transactions that occurred only within the last fiscal quarter. Sorting arranges this filtered data logically, surface-leveling outliers or top-performing assets.
2. The Power of Data Aggregation: Summarizing Complexity
While data manipulation refines individual data points, data aggregation steps back to view the macro picture. Aggregation is the process of gathering raw data from multiple sources or rows and summarizing it into a unified, statistical format.
The Split-Apply-Combine Strategy
The foundational paradigm of data aggregation is the "Split-Apply-Combine" strategy, popularized by data scientist Hadley Wickham.
[Raw Data] ---> Split by Category ---> Apply Function (Sum/Avg) ---> Combine Results
Split: The dataset is divided into distinct groups based on a specific variable (e.g., grouping a retail dataset by "Store Location").
Apply: A statistical function is executed on each group independently (e.g., calculating the average sales revenue for each location).
Combine: The individual summaries are merged back into a new, highly condensed dataset.
Core Aggregation Functions
Aggregation condenses thousands of rows into critical key performance indicators (KPIs) using functions such as:
Sum: Totaling values (e.g., total quarterly revenue).
Mean/Median: Finding central tendencies (e.g., average customer lifespan value).
Count: Measuring frequency (e.g., number of transactions per day).
Min/Max: Identifying boundaries (e.g., lowest and highest stock prices during a trading session).
3. Essential Tools of the Trade
The modern data science ecosystem features robust libraries designed to handle manipulation and aggregation efficiently, scaling from local machines to massive cloud clusters.
Pandas (Python)
Pandas is the industry standard for tabular data manipulation in Python. Built on top of NumPy, it introduces the DataFrame structure.
Key Operations: Functions like
.fillna()handle missing data,.astype()manages type conversion, and the incredibly powerful.groupby()method executes the Split-Apply-Combine workflow seamlessly.
Tidyverse / dplyr (R)
For statisticians and researchers using R, the dplyr package (part of the Tidyverse collection) offers an intuitive, readable syntax based on verbs.
Key Operations: It utilizes functions like
filter(),mutate()(to create new columns),group_by(), andsummarize()connected via the pipe operator (%>%), making code highly legible.
SQL (Structured Query Language)
When data resides in relational databases, manipulating it at the database level before exporting it to Python or R is highly efficient.
Key Operations: SQL utilizes clauses like
WHEREto filter,CASE WHENto manipulate values conditionally, andGROUP BYpaired with aggregate functions (SUM,AVG) to condense data directly within the server engine.
4. Advanced Manipulation Techniques
As datasets grow in complexity, advanced structural manipulations become necessary to prepare data for predictive modeling.
Pivoting and Reshaping
Datasets are typically structured in one of two ways:
Wide Format: Each variable has its own column (e.g., columns for Jan_Sales, Feb_Sales, Mar_Sales).
Long Format: Variables are stacked vertically, with one column defining the metric and another defining the value.
Data manipulation allows seamless transitions between these formats using "melt" (wide to long) and "pivot" (long to wide) operations, which is crucial for time-series analysis and visualization formatting.
Merging and Joining Datasets
Data rarely lives in a single file. Data scientists must frequently combine information from multiple tables using shared identifier keys:
Inner Join: Retains only rows with matching keys in both datasets.
Left Join: Retains all rows from the primary dataset and appends matching data from the secondary dataset.
5. Real-World Case Study: E-Commerce Analytics
To visualize these concepts in action, consider a global e-commerce platform processing millions of raw transaction logs daily. The raw data contains user IDs, timestamps, item categories, purchase amounts, and shipping addresses.
Without manipulation and aggregation, this data is an unreadable wall of text logs. Here is how a data scientist extracts value from it:
Manipulation Stage:
The scientist filters out canceled or fraudulent transactions.
Missing values in the "Shipping Address" column are flagged or removed.
Timestamps are converted into dedicated "Hour", "Day", and "Month" columns.
Aggregation Stage:
The scientist groups the data by "Customer ID" and aggregates using
SUM(Purchase_Amount)andCOUNT(Transaction_ID)to calculate the lifetime value and purchase frequency of every customer.The data is grouped by "Month" and "Item Category" using
AVG(Purchase_Amount)to track seasonal buying trends.
The result transforms millions of messy rows into a concise summary table, directly identifying VIP customers and trending products for the marketing team.
Conclusion: The Backbone of Data Intelligence
Data manipulation and aggregation are not merely administrative tasks; they are creative, analytical processes that dictate the success of any data science initiative. A machine learning model is only as good as the data fed into it—a reality summarized by the classic computer science adage: "Garbage in, garbage out."
By mastering the art of cleaning, reshaping, grouping, and summarizing data, data scientists unlock the narratives hidden within raw numbers. Whether utilizing Python, R, or SQL, these core competencies bridge the gap between incomprehensible raw data engineering and high-level predictive intelligence.
Did you find this ICT insight helpful?