Supervised Learning: The Power of Algorithmic Classification
Understanding Supervised Learning: The Power of Algorithmic Classification.
Imagine walking into a chaotic room filled with unlabelled mail. Your task is to sort these items into distinct bins: "Bills," "Personal Letters," "Junk Advertisements," and "Packages." As a human, you perform this task instantly. You scan the sender, recognize the layout, spot keywords like Overdue or Special Offer, and categorize the item.
In the digital world, teaching a machine to perform this exact sorting process is known as Supervised Learning, specifically the subfield of Classification.
Classification algorithms power the invisible infrastructure of our modern digital life. From the filtration systems keeping spam out of our email inboxes to the cutting-edge medical technologies identifying early-stage tumors, classification maps raw data into meaningful, actionable categories.
1. What is Supervised Learning?
To understand classification, we must first break down the concept of Supervised Learning.
Supervised learning is a branch of machine learning where a model is trained using labeled data. Think of it as learning a new subject with the help of a dedicated teacher. The "teacher" provides the algorithm with a dataset consisting of both the inputs (features) and the correct answers (targets/labels).
The mathematical goal of a supervised learning algorithm is to learn a mapping function (f) that accurately maps an input variable (X) to an output variable (Y):
\(Y=f(X)\)
During the training phase, the algorithm makes predictions on the input data. The "teacher" compares these predictions against the true labels, calculates the error, and adjusts the model's internal parameters to minimize that error. This process repeats until the model reaches a high level of accuracy. Once trained, the model is exposed to brand-new, unseen data, where it must predict the correct labels entirely on its own.
The Two Pillars: Regression vs. Classification
Supervised learning is broadly split into two categories based on the nature of the output variable (Y):
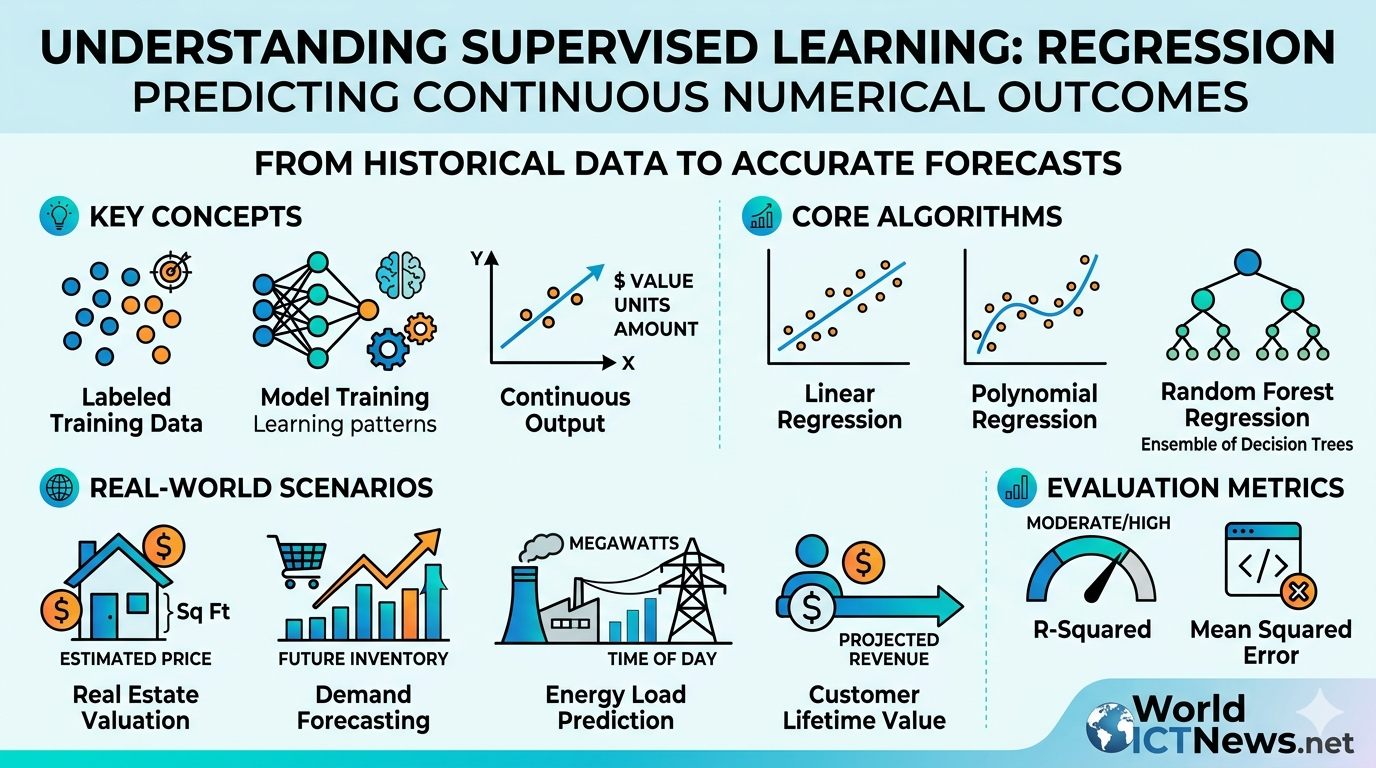
Regression: Predicts a continuous, numerical value (e.g., predicting the price of a house, the temperature tomorrow, or stock market trends).
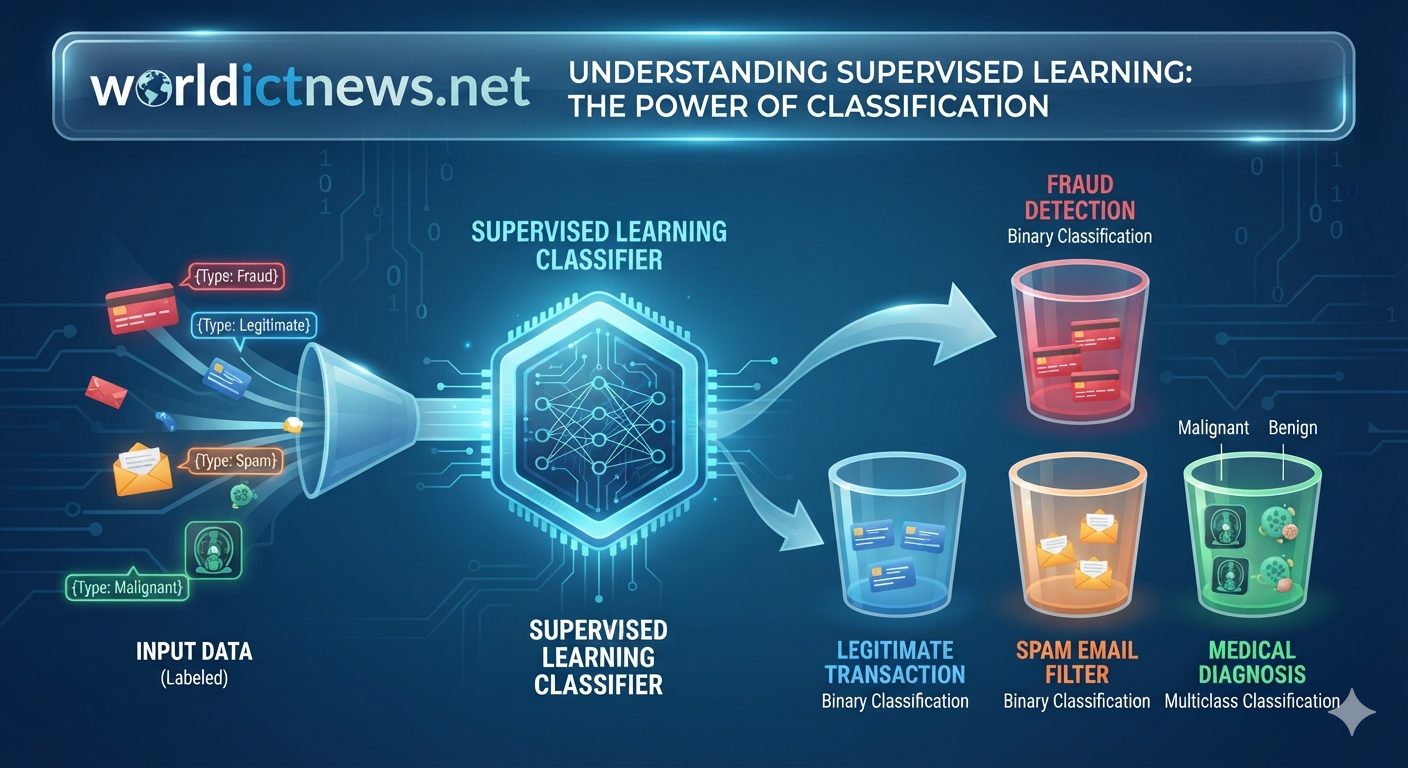
Classification: Predicts a discrete, categorical label or class (e.g., sorting an email as "Spam" or "Not Spam," or identifying an image as a "Cat" or "Dog").
2. Deep Dive Into Classification
Classification is the process of predicting the category of a given data point. The categories are discrete, mutually exclusive values that represent classes within the dataset.
Depending on the number of classes involved, classification tasks are divided into three major types:
Binary Classification
The simplest form of classification, where the target variable has exactly two possible outcomes. The algorithm must choose between one of two classes, often framed as positive/negative or true/false.
Mathematical Representation: \(Y \in \{0, 1\}\)
Examples: Defaulted on a loan vs. Paid back a loan; Disease detected vs. No disease detected.
Multiclass Classification
A classification task with more than two unique classes. The algorithm must assign a data point to exactly one category out of many possibilities.
Mathematical Representation: \(Y \in \{1, 2, 3, \dots, C\}\) where C is the total number of classes.
Examples: Sorting ecommerce products into "Electronics," "Apparel," or "Home Decor"; Identifying handwritten digits from 0 to 9.
Multilabel Classification
A nuanced variation where a single data point can belong to multiple classes simultaneously. Instead of choosing one exclusive label, the model assigns a set of target labels to each sample.
Examples: Tagging a news article with "Politics," "Economy," and "Europe" all at once; Identifying multiple objects within a single photograph (e.g., a photo containing a car, a pedestrian, and a traffic light).
3. Core Classification Algorithms
Different classification problems require different mathematical approaches. Here are the five foundational algorithms used by data scientists globally:
Logistic Regression
Despite its confusing name, Logistic Regression is used for classification, not regression. It is primarily used for binary classification. Instead of fitting a straight line through the data points, it applies the Sigmoid function to output a probability value between 0 and 1.
The standard Sigmoid function is defined mathematically as:
\(S(z)=\frac{1}{1+e^{-z}}\)
If the output probability is greater than a set threshold (typically 0.5), the model assigns the data point to class 1; otherwise, it assigns it to class 0.
Decision Trees
A Decision Tree breaks down a dataset into smaller and smaller subsets while at the same time an associated decision tree is incrementally developed. The final result is a tree with decision nodes (e.g., Is income > $50,000?) and leaf nodes (e.g., Approve Loan / Reject Loan). It mimics human decision-making, making it incredibly transparent and easy to interpret.
Random Forest
A single decision tree can be fragile and prone to making mistakes. A Random Forest fixes this by building an entire "forest" of independent decision trees. Each tree is trained on a random subset of data and features. When a new data point needs to be classified, every tree in the forest votes on the outcome. The class with the most votes wins. This technique is known as an ensemble method.
Support Vector Machines (SVM)
The goal of a Support Vector Machine is to find a line or boundary—called a hyperplane—that distinctly segregates data points into their respective classes. SVM looks for the maximum margin, meaning it positions the hyperplane so that the distance between the line and the closest data points of both classes (the support vectors) is as wide as possible.
Naive Bayes
Based on Bayes' Theorem, this probabilistic classifier assumes that the presence of a specific feature in a class is completely unrelated to the presence of any other feature (hence the word "Naive"). Despite this oversimplification, it is incredibly fast, computationally efficient, and highly effective for text-based analysis.
4. Real-Life Scenarios and Applications
To fully grasp how classification shapes our world, let us look at five detailed, real-world case studies across different industries.
Scenario A: FinTech — Credit Card Fraud Detection
Classification Type: Binary Classification (Fraudulent vs. Legitimate)
Algorithms Used: Random Forest, Logistic Regression, Support Vector Machines
Every single second, millions of credit card transactions occur worldwide. Banks must analyze these transactions in real-time to stop thieves before a purchase is finalized.
When you swipe your credit card at a local coffee shop, a classification model immediately runs in the background. It analyzes a series of quantitative features:
Transaction Amount: Is this charge significantly larger than your average purchase size?
Location: Are you suddenly making a purchase in Paris, France, when your phone's GPS logs you in New York, USA?
Time of Day: Is this transaction happening at 3:00 AM on a Tuesday?
Merchant Category: Is it a high-risk vendor type (like a luxury jewelry store or electronics marketplace)?
The algorithm processes these numbers through its trained model. Within milliseconds, it calculates a fraud probability score. If the model outputs a probability value higher than the threshold, the transaction is instantly classified as "Fraudulent." The card is locked, the transaction is declined, and an automated SMS text message is pushed to your smartphone asking you to verify the charge.
Scenario B: Healthcare — Radiology and Tumor Diagnosis
Classification Type: Binary or Multiclass Classification (Benign vs. Malignant vs. Healthy Tissue)
Algorithms Used: Deep Learning Convolutional Neural Networks (CNNs), Support Vector Machines
Medical imaging generates vast mountains of data, but human radiologists face fatigue, visual blind spots, and severe time constraints. Supervised classification assists doctors by analyzing medical scans (X-rays, MRIs, and CT scans) to spot early-stage anomalies.
Consider a breast cancer screening initiative using mammograms. The supervised learning model is trained on hundreds of thousands of historical mammogram images. Each image in the training set has been painstakingly reviewed and labeled by expert oncologists as either "Benign" (non-cancerous tumor) or "Malignant" (cancerous tumor).
The algorithm breaks the image down into pixels, learning to recognize distinct visual features like density, irregular borders, and micro-calcifications that are invisible to the naked eye. When a new patient undergoes a routine scan, the model processes the image. It classifies specific areas of the tissue. If it flags an area as "Malignant," it acts as an early warning system, drawing the radiologist’s immediate attention to that specific coordinate for an urgent biopsy.
Scenario C: E-Commerce & Customer Service — Email Spam Filtering & Sentiment Analysis
Classification Type: Binary (Spam/Ham) and Multiclass (Positive, Neutral, Negative Sentiment)
Algorithms Used: Naive Bayes, Support Vector Machines, Recurrent Neural Networks
Digital communication produces vast text oceans. E-commerce corporations use sentiment analysis classifiers to monitor customer reviews, social media mentions, and support tickets to understand public perception instantly.
When a customer posts a review saying, "The product arrived two days late, and the customer support line was completely useless," a text classification model goes to work. First, the text is pre-processed (removing punctuation and converting words to lowercase). Next, the Naive Bayes algorithm calculates the probability of specific negative words occurring together.
The review is automatically labeled as "Negative" and assigned a category tag like "Shipping Delay" or "Poor Support." The company's automated routing system detects this classification and moves this specific customer ticket to the front of the queue, allowing an emergency customer service representative to reach out with a refund voucher before the customer vents on social media.
Scenario D: Logistics & Tech — Autonomous Vehicle Sign Recognition
Classification Type: Multiclass Classification (Stop Sign vs. Speed Limit vs. Yield vs. Pedestrian Crossing)
Algorithms Used: Deep Learning, Decision Trees, K-Nearest Neighbors
For a self-driving car to navigate safely down an urban street, it must actively perceive and react to its physical surroundings. It accomplishes this using vehicle cameras paired with a computer vision multiclass classifier.
As the autonomous vehicle moves forward, its camera captures video frames continuously. An image segmentation tool crops out rectangular bounding boxes around geometric shapes along the side of the road. These cropped images are fed directly into a multiclass classifier.
The model must instantly sort the image into one of dozens of specific traffic sign classes. Is it a "Stop Sign"? Is it a "Speed Limit 50" sign? Is it a "One Way" indicator? If the model classifies an image with 99% confidence as a "Stop Sign," that categorical classification output is handed off to the vehicle’s mechanical control loop, which automatically applies the brakes to bring the car to a safe stop at the white line.
5. Summary Table of Applications
Scenario | Input Features (X) | Target Output (Y) | Classification Type | Impact |
|---|---|---|---|---|
FinTech Fraud | Location, Amount, Time, Vendor | Fraudulent vs. Legitimate | Binary | Protects consumer capital |
Healthcare Imaging | Pixel Density, Texture, Boundaries | Benign vs. Malignant | Binary / Multiclass | Early, life-saving detection |
E-Commerce Text | Customer Review Sentences, Keywords | Positive, Neutral, Negative | Multiclass | Automated customer care |
Self-Driving Cars | Camera Frames, Edges, Colors, Shapes | Stop, Yield, Speed Limit | Multiclass | Safe autonomous navigation |
6. Challenges in Classification
While supervised classification models are exceptionally powerful, they are not flawless. Building a reliable model requires overcoming several classic machine learning hurdles:
Overfitting vs. Underfitting
Overfitting occurs when an algorithm learns the training data too well. It memorizes the noise, random fluctuations, and quirks of the specific training set instead of learning the underlying concept. When exposed to new data, an overfitted model fails drastically.
Underfitting happens when the model is too simple to capture the underlying trend in the data (e.g., trying to fit a complex, curved boundary using a simple straight line).
Data Imbalance
In many real-world scenarios, one class heavily outnumbers the other. For instance, in credit card fraud detection, 99.9% of transactions are legitimate, while only 0.1% are fraudulent. If an algorithm simply predicts "Legitimate" for every single transaction, it will achieve a staggering 99.9% accuracy rate, yet it is completely useless for catching thieves. Data scientists must use specialized techniques like oversampling the minority class, undersampling the majority class, or using synthetic data generation (SMOTE) to fix this issue.
The Black Box Dilemma
Advanced classifiers, such as deep neural networks, can achieve near-perfect classification accuracy, but they are incredibly complex. They operate as a "black box," meaning it is nearly impossible for a human to decipher exactly why the model made a specific prediction. In high-stakes fields like healthcare or criminal justice, a lack of explainability can pose major ethical and regulatory problems.
7. Conclusion
Supervised learning classification is much more than an academic concept; it is a vital engine running our modern world. By taking structured historical information and using it to map out distinct boundaries, classification models bring order, safety, and efficiency to vast seas of unpredictable real-world data.
As algorithms become more advanced and datasets grow richer, the accuracy of these automated systems will continue to sharpen. The future of technology relies heavily on teaching machines not just to process data, but to understand exactly what that data represents.
Did you find this ICT insight helpful?