Statistics: Skewness and Kurtosis
Skewness in Statistics.
Skewness is used to determine how asymmetrical a distribution is. It tells you whether your data leans toward one side of the mean or the other.
The mean, median, and mode are all equal in a perfectly normal distribution. The curve is symmetrical on both sides. However, most real-world data isn’t perfectly balanced. The values are concentrated at one end, so the tail is pulled towards the other end. Skewness measures that "pull".
A skewness value of zero indicates a perfectly symmetric distribution
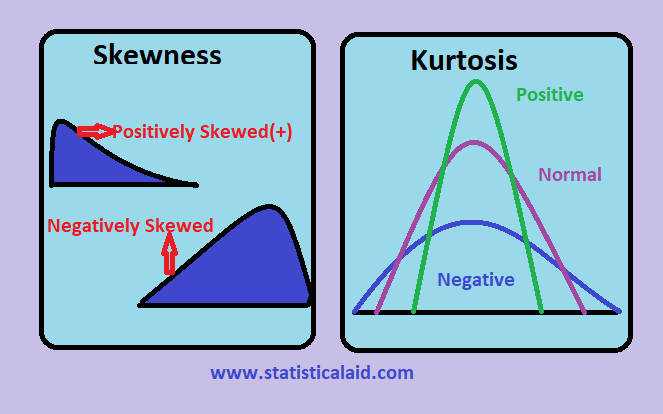
Positive values point to a right-leaning tail
Negative values point to a left-leaning tail
The further the value moves from zero, the more asymmetric your data is.
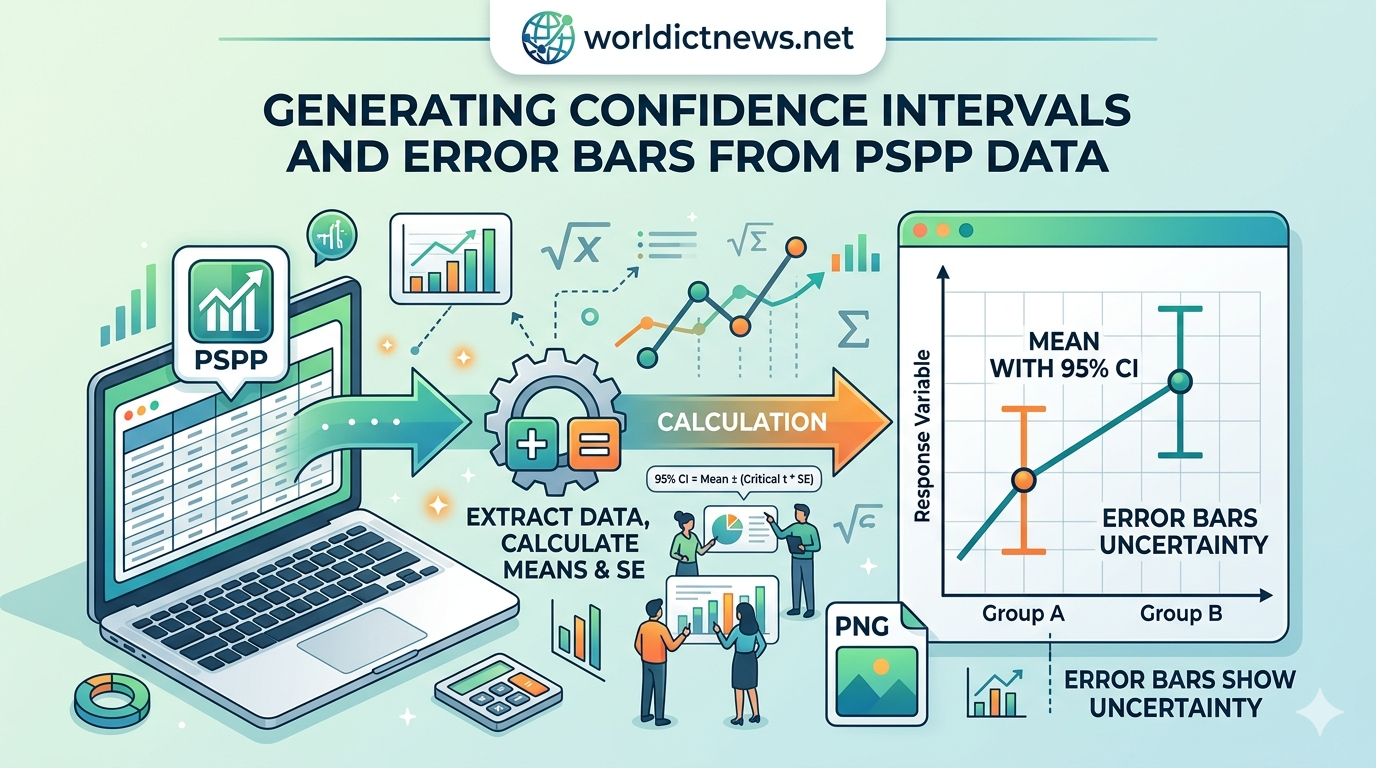
Skewness is important because it directly affects the interpretation of the mean. In a skewed distribution, the mean is pulled towards the tail, and it no longer accurately represents a typical value. Early awareness of the meaning helps you select appropriate statistical methods and avoid drawing conclusions unsupported by the data.
Kurtosis Definition
As skewness tells you of the direction of the lean in your data, kurtosis meaning tells you: "how sharp or how flat the peak of your distribution is, and how much the weight lies in the tails."
To be more precise, kurtosis is used to understand how many extreme values you have, relative to a normal distribution. A high-peaked, sharp-tailed distribution has very different behavior from a broad and flat one, even if both have the same mean and standard deviation. That difference is captured by kurtosis.
The kurtosis value of a normal distribution is 3 and is used as the reference point. Some analysts use excess kurtosis, obtained by subtracting 3 from the raw value, so that the scores of the normal distribution are zero, making comparisons easier to interpret.
When kurtosis is high, you are more likely to find extreme values in your data
When it is low, the distribution has lighter tails, meaning fewer extreme values
This makes kurtosis particularly useful in areas such as finance and risk analysis, where knowing the likelihood of extreme outcomes is not only helpful but necessary.
Did you know? Data is typically considered approximately normal only when skewness and excess kurtosis both fall between -1 and +1. (Source: PMC, Descriptive Statistics and Normality Tests)
Types of Skewness
There are three types, and the distinction is straightforward.
1. Positive Skewness (Right-Skewed)
In a positively skewed (right-skewed) distribution, most values are concentrated on the left side, while the tail extends toward the right. Because of the long right tail, the mean is typically greater than the median, and the median is greater than the mode.
In this distribution, Mean > Median > Mode
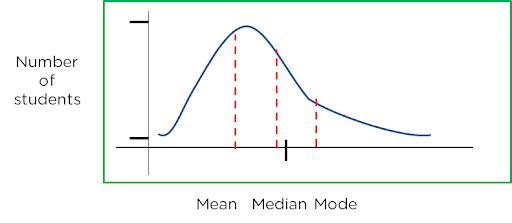
Figure: Positive Skewness
2. Negative Skewness (Left-Skewed)
In a negatively skewed, or left-skewed, distribution, most data points are concentrated toward the right side, while the tail extends toward the left. Because of this longer left tail, the mean is typically less than the median, and the median is less than the mode.
In this distribution, Mode > Median > Mean
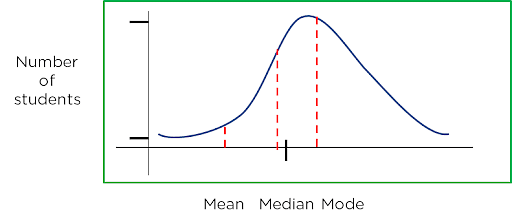
Figure: Negative Skewness
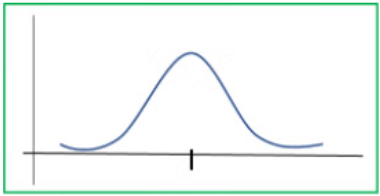
3. Zero Skewness (Symmetric)
A perfectly balanced distribution on either side gives a zero skewness. Mean, median, and mode are all equal, and neither tail is heavier than the other. This is the normal distribution in its ideal form.
Types of Kurtosis
Kurtosis has three types, based on the value.
1. Leptokurtic (Positive Kurtosis)
A leptokurtic distribution is one with a kurtosis greater than 3.
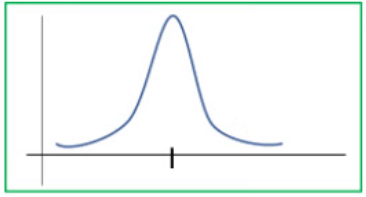
Leptokurtic (Positive Kurtosis)
It has a tall, sharp peak and thick tails; that is, data is extremely concentrated around the mean; however, when extreme values occur, they may be important. There is a higher likelihood of outliers in this type than in the normal distribution.
2. Platykurtic (Negative Kurtosis)
Platykurtic distributions have a kurtosis value below 3.
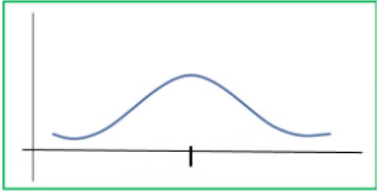
Platykurtic (Negative Kurtosis)
The peak is flatter and wider, and the tails are thinner. Here, the data are more widely distributed, with fewer extreme values. The distribution is nearly stretched compared to a normal curve. A good example of platykurtic behavior is a uniform distribution.
3. Mesokurtic (Kurtosis = 3)
Mesokurtic Kurtosis
This is the baseline, the normal distribution itself. The kurtosis of a mesokurtic distribution is exactly 3, with balanced peaks and tails, which is taken as the reference point for comparing leptokurtic and platykurtic distributions.
Did You Know? A 2025 study found that the power and reliability of normality tests vary substantially with skewness and kurtosis, especially in small samples. (Source: Springer Link, BMC Medical Research Methodology, ‘as of Sep 2025’.)
Formula for Skewness and Kurtosis
Having understood the meaning of skewness and kurtosis in principle, the next step is to learn how to calculate them. The formula for skewness and kurtosis is a direct result of the concepts; both of them represent the shape of a distribution in the form of a number that you can calculate, compare, and operate on.
Skewness Formula
Pearson's skewness coefficient is the most commonly employed, and it exists in two forms:
Pearson's First Coefficient of Skewness = (Mean - Mode)/Standard deviation
Pearson's Second Coefficient of Skewness = 3(Mean - Median)/Standard deviation
When the mode is unclear or unstable, as with continuous data, the second coefficient is usually used. The two formulas are used to determine the distance between the mean and the center of the distribution, normalized by the standard deviation, to make the outcome similar across data sets.
Interpreting skewness values:
-0.5 to 0.5 → Approximately symmetric
-1 to -0.5 or 0.5 to 1 → Moderately skewed
Less than -1 or greater than 1 → Highly skewed
Kurtosis Formula
The kurtosis formula quantifies how steep the peak is and the weight of the tails when compared to a normal distribution:
K = [Σ(X - X̄)⁴ / n] / s⁴
Where:
X = each data point
Xˉ= mean of the dataset
n = number of data points
s = standard deviation
This gives you the raw kurtosis value, where 3 is the baseline for a normal distribution. Practically, excess kurtosis has often been used by many analysts, which is computed as:
Kexcess = K-3
This is just a simple re-centering of the scale so that a normal distribution assigns a score of zero, making it easy to quickly determine whether the distribution has heavier or lighter tails than normal.
When excess kurtosis is positive, tails are heavier,
When it is negative, they are lighter.
Difference Between Skewness and Kurtosis
Dimension | Skewness | Kurtosis |
What it measures | Asymmetry of the distribution | Peakedness and tail weight |
Core question answered | Which direction does data lean? | How extreme are the tails? |
Reference value | 0 (perfectly symmetric) | 3 (normal distribution) |
Positive value means | The right tail is longer | Sharper peak, heavier tails (Leptokurtic) |
Negative value means | The left tail is longer | Flatter peak, lighter tails (Platykurtic) |
Effect on the mean | Mean is pulled toward the tail | Mean may remain centered, but outliers increase |
Typical use case | Detecting directional bias in data | Detecting outlier-proneness and tail risk |
Real-world example | Income distribution, exam scores | Stock market returns, insurance claims |
The key takeaway is that kurtosis and skewness complement each other. Skewness describes the direction of distortion in a distribution, and kurtosis describes the degree to which the distribution's tails extend. Both are required to see the whole picture.
Why Skewness and Kurtosis Matter in Statistics?
Mean and standard deviation are great starting points; however, they don't give you all the information about your data. What those summary statistics lack is filled in by skewness and kurtosis in statistics.
Here's why they matter in practice:
They expose when the mean is misleading. The mean in a skewed distribution is pulled towards the tail. When you are making decisions using it, budgeting, performance, and risk estimation, skewness in statistics informs you on whether the mean is actually credible.
They reveal outlier risk. High kurtosis indicates heavier tails, meaning extreme values are more likely than a normal distribution would suggest. Many financial models that failed during market downturns did so because they assumed normality and overlooked this entirely.
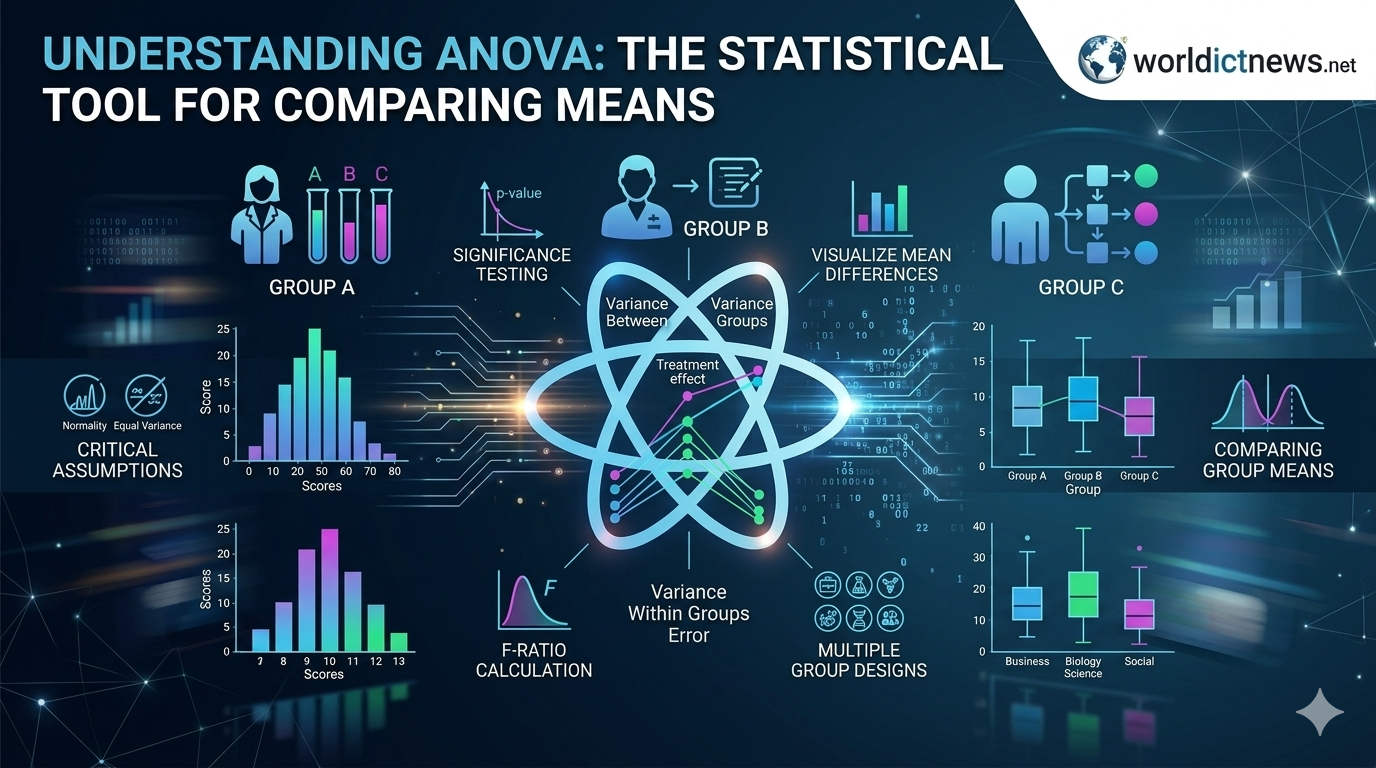
They determine which statistical tests are valid. Tests such as t-tests, ANOVA, and linear regression assume approximate normality. Once skewness or kurtosis deviates significantly, those assumptions fail, and so do your results.
They're essential in machine learning. Highly skewed features can distort model training. Checking and correcting skewness before modeling is a standard preprocessing step that directly affects performance.
Skewness and Kurtosis Quick Diagnosis Checklist Before running any statistical analysis, run through this: Calculate the skewness value:
Calculate kurtosis value:
Final Check: If both deviate significantly → avoid t-tests, ANOVA, and standard regression without adjustment |
Examples of Skewness and Kurtosis
Real-world data is rarely textbook-perfect, and these examples of kurtosis and skewness show up across different fields.
Income Distribution: Positive Skewness
The majority of people earn less than the national average, and a small group of very high earners lies much farther to the right in the tail.
This pulls the mean upward, rendering it an inaccurate depiction of average income. It's why median income is a more honest benchmark.
Exam Scores: Negative Skewness
When an exam is straightforward, most students score high and only a few score very low. Data clusters toward the upper end with a long left tail, a clean example of negative skewness that teachers encounter regularly.
Stock Market Returns: Leptokurtic
Daily returns have a small average, though large gains or losses are much more frequent than they would be according to a normal distribution.
These include the so-called "fat tails," which are characteristic of high kurtosis and are precisely why conventional risk models tend to underestimate the likelihood of a market crash.
Rainfall Data: Platykurtic
In places where seasonal rains occur regularly, there are no peaks or extreme variations in monthly rainfall. This flat, wide distribution is typical platykurtic behavior, with kurtosis below 3 and no surprises at either end.
Manufacturing Quality Control: Zero Skewness
A well-functioning production process keeps measurements like component dimensions or fill weights symmetrically centered around a target value. Skewness near zero means the process is on track. Any drift signals something's gone wrong.
Key Takeaways
Kurtosis and skewness are not limited to the mean; they describe the true shape of a distribution, making them essential for any honest data analysis
Skewness tells you which direction your data leans; kurtosis tells you how extreme the tails are. You need both to understand a distribution fully
High kurtosis or heavy skewness may invalidate other commonly used statistical tests, making these checks a non-negotiable step before any analysis
In practice, in fields such as finance, healthcare, and machine learning, these two measures are directly involved in decision-making, including risk assessment and model preprocessing
Did you find this ICT insight helpful?