The Latest in

ICT Articles & Tutorials

World ICT News is a professional platform dedicated to Artificial Intelligence, Cloud Computing, DevOps, and Cybersecurity. Empowering the next generation of ICT specialists. Our exclusive tutorials and articles are designed to serve as a stepping stone for you into the world of ICT industry...

Python: The Unified Backbone of Cybersecurity and Artificial Intelligence
Jun 10, 2026
6 min read

Python: The Unified Backbone of Cybersecurity and Artificial Intelligence

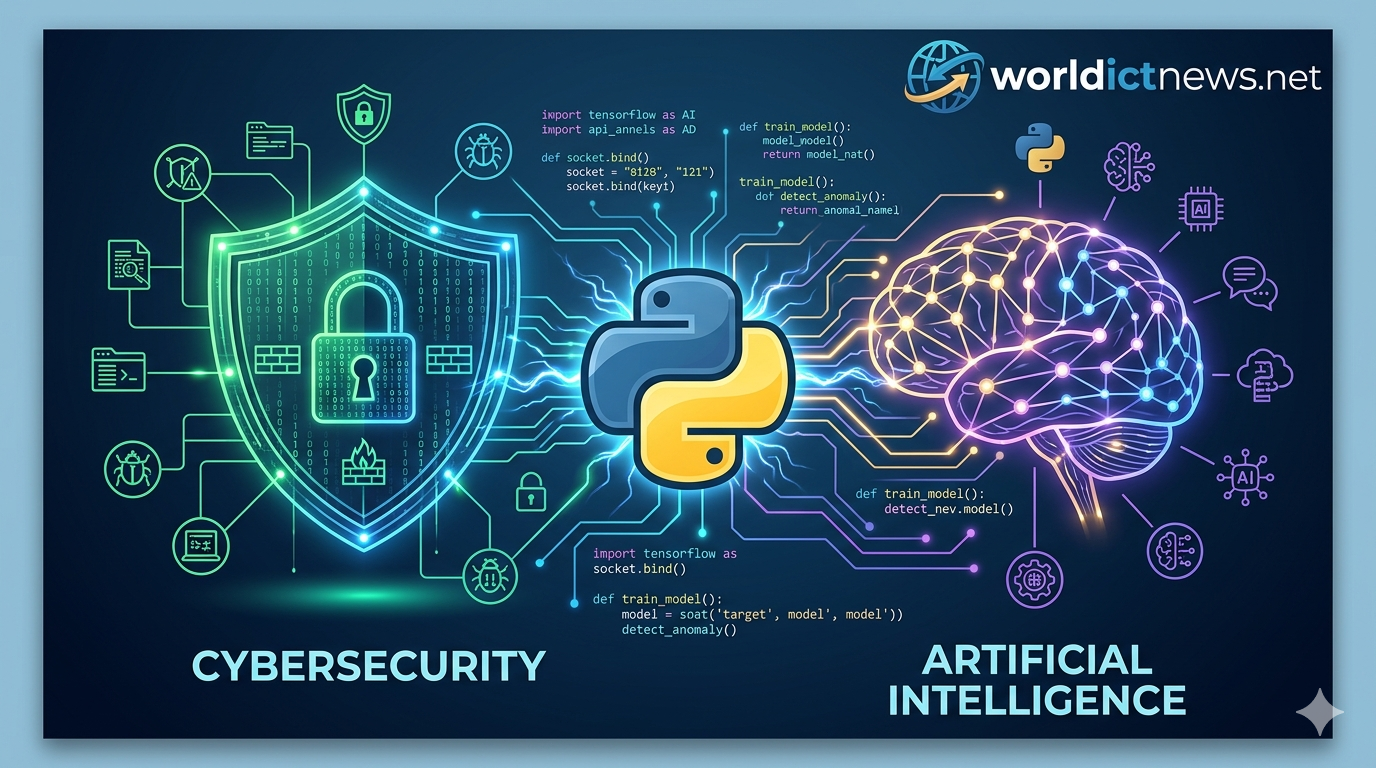
Python: The Unified Backbone of Cybersecurity and Artificial Intelligence. In the modern technology landscape, two domains stand out for their profound impact on global security and economic evolution: Cybersecurity and Artificial Intelligence (AI). Interestingly, these fields are increasingly dependent on each other. As cyber threats become more complex, defending digital networks requires the speed and adaptability of AI. Conversely, securing complex machine learning pipelines from adversarial tampering has become a foundational challenge in modern engineering.At the intersection of these fields sits a single common denominator: the Python programming language.Python has evolved from its origins as a basic scripting language into the primary computational language for both security engineers and data scientists. Its transition into an industry standard is not accidental. This article examines the architectural traits that make Python indispensable, its specific applications within cybersecurity and AI, and how its dual mastery is reshaping digital defense networks.The Blueprint of Ubiquity: Why Python Rules Both SectorsThe concurrent dominance of Python in two entirely separate engineering fields stems from several structural advantages designed directly into the language. ┌────┐ │ WHY PYTHON RULES THE TECH │ └─┬──┘ │ ┌──┼──┐ ▼ ▼ ▼┌───┐ ┌───┐ ┌───┐│ READABILITY │ │ C-LEVEL SPEED │ │ EXTENSIVE VENDOR │├──┤ ├─┤ ├──┤│ • Clean syntax │ │ • Wrapper for C │ │ • Massive ecosystem││ • Rapid prototyping│ │ • NumPy/PyTorch │ │ • Scapy, PyCrypt │└───┘ └───┘ └───┘1. Syntax Simplicity and Rapid PrototypingIn cybersecurity, time is the ultimate currency during an active breach response. Similarly, in AI research, the ability to rapidly iterate on an experimental hypothesis defines competitive advantage. Python's clear syntax mimics standard English, minimizing boilerplate code. This lets engineers focus on solving logic problems rather than parsing memory pointers or debugging missing semicolons.2. The Power of "Glue Language" PerformanceA frequent criticism of Python is its execution speed compared to compiled languages like C++ or Go. However, Python addresses this limitation by functioning as an exceptional "glue language."The underlying performance-heavy computation in Python packages is actually written in C or C++. Python provides a clean, highly readable wrapper interface over these compiled binaries. For example, when an AI model processes multidimensional arrays using NumPy or PyTorch, the operations run at near-native C speeds.3. An Extensive Ecosystem of Specialized PackagesPython boasts a highly comprehensive repository of pre-built modules. Instead of constructing low-level packet sniffers or backpropagation algorithms from scratch, developers can instantly import robust, battle-tested solutions:For Security: Libraries like Scapy (packet manipulation), Paramiko (SSH connections), and Cryptography handle complex protocols natively.For Artificial Intelligence: Ecosystems like TensorFlow, PyTorch, Scikit-Learn, and Hugging Face Transformers provide ready-made access to cutting-edge machine learning research.Part I: Python as the Swiss Army Knife of CybersecurityIn cybersecurity, Python is heavily used across offensive penetration testing, defensive security operations, and digital forensics.┌─────┐│ PYTHON IN CYBERSECURITY OPERATING │├───┬────┬──┤│ OFFENSIVE │ DEFENSIVE │ FORENSICS │├─┼──┼──┤│ • Custom Scanners │ • Automated SIEM │ • Log Parsing ││ • Exploit Dev │ • Firewall Rules │ • Volatility ││ • Credential Test │ • Threat Hunting │ • Registry Scan│└──┴──┴──┘1. Offensive Security and Penetration TestingSecurity professionals must routinely think like attackers to uncover infrastructure vulnerabilities. Python plays a central role in automating network reconnaissance and weaponized exploit delivery:Custom Port Scanning: While tools like Nmap exist, a pentester frequently requires a customized script to scan obscure protocol structures. Using Python’s native socket library, an engineer can write an asynchronous scanner in under 20 lines of code.Credential Stuffing and Brute Forcing: Security specialists use the requests library to build multi-threaded authentication test scripts. These tools stress-test web applications by evaluating password strengths against known corporate credential databases.2. Security Operations (SecOps) and AutomationModern Security Operations Centers (SOCs) are constantly flooded with thousands of security alerts every hour. Human analysts cannot review this volume manually. Python serves as the underlying language for Security Orchestration, Automation, and Response (SOAR) pipelines.When a Security Information and Event Management (SIEM) platform flags an anomalous IP address, a background Python script triggers automatically.The script queries threat intelligence APIs, cross-references internal databases, adds a temporary block rule to the firewall, and isolates the compromised endpoint on the network.3. Malware Analysis and Digital ForensicsWhen a system is compromised, digital forensics investigators use Python to parse memory images and track attacker behavior. Frameworks like Volatility (written in Python) allow analysts to carve through raw RAM dumps to extract active network sockets, injected DLL files, and hidden processes run by malware strains.Part II: Python as the Engine of Artificial IntelligenceArtificial Intelligence has transitioned away from hardcoded expert systems into data-driven machine learning models. Python provides the necessary infrastructure to manage this entire data life cycle.[Raw Big Data] ──► [Pandas Data Processing] ──► [PyTorch/TensorFlow Training] ──► [AI Inference Model]1. Data Collection and ProcessingAn AI model is only as good as the data used to train it. Python libraries like Pandas and NumPy enable data scientists to clean, manipulate, and restructure millions of rows of data. It handles missing attributes, eliminates anomalous feature errors, and normalizes values so they are ready for model ingestion.2. Training Deep Neural NetworksThe modern renaissance in Generative AI, Large Language Models (LLMs), and computer vision is powered by deep learning frameworks built explicitly for Python.PyTorch (Meta): Popular in academic research and cutting-edge corporate labs for its dynamic computation graphs, making it highly customizable.TensorFlow (Google): Designed with production scaling in mind, optimizing models to run efficiently across clusters of thousands of enterprise Graphics Processing Units (GPUs).3. Natural Language Processing (NLP)Technologies like ChatGPT rely on NLP to understand and respond to human language. Using Python's Transformers library, an engineer can download a pre-trained model, fine-tune it on proprietary documentation, and deploy a responsive enterprise agent in an afternoon.Part III: The Convergence (AI-Driven Autonomous Cyber Defense)The true shift occurs where cybersecurity and artificial intelligence merge. As attackers adopt automated tools, traditional static security strategies (like hardcoded firewall rules or signature-based antivirus files) are no longer sufficient. Modern cyber defense requires dynamic, Python-orchestrated AI engines to match this speed.┌───┐│ THE CYBER-AI THREAT MATRIX │├──┬─┤│ DEFENSIVE MACHINE │ OFFENSIVE AI MALWARE │├─┼─┤│ • Behavioral Anomalies │ • Adaptive Phishing Emails ││ • Deep-Packet Inspection │ • Dynamic Signature Shifts ││ • Predictive Threat Hunting│ • Automated Exploit Logic │└─┴─┘1. AI Anomaly Detection in Network TrafficInstead of relying on a list of banned IP addresses, security systems train unsupervised machine learning models (such as Isolation Forests or Autoencoders) directly on regular corporate network logs.Using Python, these models establish a baseline of "normal user behavior." If an account suddenly downloads 500 encrypted files at 3:00 AM from an atypical geographical location, the AI model flags the behavioral anomaly instantly, stopping potential ransomware propagation in its tracks.2. Combating AI-Generated Social EngineeringAttackers are now using Large Language Models to generate highly convincing, personalized spear-phishing emails at scale. To counter this, defensive engineering groups use Python to build NLP classification models that inspect incoming email semantics. These models can flag the subtle linguistic styles characteristic of AI-generated text, blocking malicious emails before they land in an employee's inbox.Conclusion: The Critical Skill for Next-Generation EngineersPython is no longer just an optional programming asset; it is the fundamental bridge connecting infrastructure security with data science. Its readability simplifies the engineering process, while its deep ecosystem provides the computational power required to process massive datasets and defend networks in real time.As autonomous malware and smart defense grids become more common, the developers and security analysts who master Python will be the ones who build—and secure—the digital infrastructure of tomorrow.
React and Vite: The Modern JavaScript Development Ecosystem
Jun 10, 2026
7 min read

React and Vite: The Modern JavaScript Development Ecosystem

React and Vite: Building the Modern JavaScript Development Ecosystem. The landscape of frontend web development has undergone a massive evolution over the last decade. In the early days of modern single-page applications (SPAs), developers routinely wrestled with complex, sluggish build configurations. For years, setting up a production-ready application meant relying on heavy bundlers like Webpack, which, despite its immense power, frequently led to frustratingly slow server start times and lagging Hot Module Replacement (HMR) speeds as projects scaled.Enter the modern combination: React and Vite.React continues to reign as the world’s most popular JavaScript library for building user interfaces, while Vite has emerged as the definitive build tool that supercharges the developer experience. Together, they form a lightweight, remarkably fast ecosystem that has effectively replaced legacy setups like Create React App (CRA).This article explores why the React-Vite pairing has become the modern industry standard, how Vite’s architecture achieves its blazing speeds, and how to harness this stack to build high-performance web applications.The Architecture of Speed: Why Vite Replaced WebpackTo understand why the developer community has enthusiastically migrated to Vite, it helps to examine how traditional bundlers operate compared to next-generation tools.LEGACY BUNDLER APPROACH (Webpack, CRA)[Entry Point] ──► [Bundle All Modules] ──► [Ready Dev Server](Result: Long wait times proportional to project size)MODERN BITE-SIZED APPROACH (Vite)[Dev Server Start] ──► [Browser Requests Module] ──► [On-Demand Transform](Result: Instant server start regardless of project size)1. The Bottleneck of Legacy BundlersTraditional bundlers like Webpack build the entire application by crawling through every module, compiling files, and creating a unified bundle before the local development server can spin up. If your React project contains hundreds of components, utility files, and heavy third-party assets, running npm start can take anywhere from 30 seconds to several minutes.2. Vite’s On-Demand ArchitectureVite (the French word for "fast," pronounced veet) completely flips this workflow on its head by leveraging two modern innovations: Native ES Modules (ESM) and Esbuild.No Pre-Bundling for Source Code: Vite serves your source code directly over native ESM. When you run your development server, Vite starts instantly because it doesn't bundle your code beforehand. Instead, it lets the browser handle module resolution. When a specific React component is rendered on your screen, the browser requests that precise file via an HTTP import request, and Vite transforms and serves that single file on the fly.Esbuild Pre-Bundling for Dependencies: Third-party dependencies (like react, react-dom, or lodash) do not change frequently during active development, but they often contain thousands of internal modules. Vite uses Esbuild—an incredibly fast bundler written in Go—to pre-bundle these dependencies into single ESM modules during your very first run. Esbuild processes dependencies up to 100 times faster than JavaScript-based bundlers.3. Instant Hot Module Replacement (HMR)In a legacy setup, saving a file forces the bundler to reconstruct pieces of the bundle matrix, slowing down the feedback loop. Vite’s HMR is decoupled from the total number of files in your application. No matter how large your codebase grows, editing a React component triggers an near-instantaneous update in the browser without reloading the page or wiping out your application's current state.Setting Up a Modern React App with ViteTransitioning away from older scaffolding tools like Create React App to Vite is remarkably simple. Vite provides an interactive command-line interface that scaffolds a clean React template in seconds.Step 1: Scaffolding the ProjectOpen your terminal and execute the initialization command:bashnpm create vite@latest my-react-app -- --template reactUse code with caution.(If you want to build with strict typing, you can substitute react with react-ts to automatically generate a TypeScript configuration).Step 2: Installation and ExecutionNavigate into your newly created project directory, install the lean dependency tree, and launch the development environment:bashcd my-react-app npm install npm run dev Use code with caution.The console will instantly display a local URL (typically http://localhost:5173/). Clicking it opens your live React application instantly.Anatomy of a Vite-React ProjectA project scaffolded by Vite looks noticeably cleaner and more intuitive than legacy boilerplate configurations.my-react-app/├── node_modules/├── public/ # Static assets served at the root path│ └── vite.svg├── src/ # Core application source code│ ├── assets/│ ├── App.css│ ├── App.jsx # Main root component│ ├── index.css│ └── main.jsx # The application entry point├── index.html # Crucial entry point at the project root├── package.json└── vite.config.js # Central configuration fileThe Shift of index.htmlIn older setups, index.html was treated as a background asset tucked away inside a public/ directory. Vite moves index.html straight to the root directory of your project.This design choice is intentional: Vite treats index.html as the actual entry point of your application. Inside the HTML file, you will find a clean, native script tag pointing directly to your JavaScript source:html<div id="root"></div><script type="module" src="/src/main.jsx"></script>Use code with caution.The vite.config.js FileVite consolidates its configuration into a single, highly readable file. Out of the box, it includes the official React plugin, which enables support for JSX parsing and optimized React HMR:javascriptimport { defineConfig } from 'vite'import react from '@vitejs/plugin-react'// https://vite.devexport default defineConfig({ plugins: [react()], server: { port: 3000, // Customize your local dev port easily }})Use code with caution.Key Capabilities of the React-Vite PipelineBeyond sheer execution speed, Vite provides several built-in optimizations that drastically streamline production workflows.1. Out-of-the-Box CSS and Asset SupportVite eliminates the need to configure complex loaders for styles or static assets:CSS Modules: Any file named with the .module.css extension is automatically recognized as a CSS Module. Vite will securely scope the class names to prevent style leakage across your React components.CSS Preprocessors: If your project requires Sass or Less, you do not need to rewrite your config files. Simply install the preprocessor compiler via npm (npm install -D sass), and Vite will interpret .scss files natively.Static Assets: Importing an image or asset inside a component (import logo from './assets/logo.png') automatically resolves to the correct public URL path in production.2. Environment Variables Made SecureLegacy tools required prefixing environment variables with REACT_APP_. Vite modernizes this approach by using the VITE_ prefix to prevent accidental exposure of sensitive server keys to the client browser.Create a .env file at your root:envVITE_API_BASE_URL=https://closedealsng.comPRIVATE_KEY=secret_12345Use code with caution.Access it cleanly inside your React components using Vite's native metadata object:javascriptconst apiEndpoint = import.meta.env.VITE_API_BASE_URL;// Note: PRIVATE_KEY will be safely inaccessible here because it lacks the VITE_ prefixUse code with caution.3. Optimized Production Bundling via RollupWhile Vite uses Esbuild for maximum speed during daily development, it switches to Rollup for compiling production-ready code when you run npm run build.Rollup is universally celebrated for producing highly optimized, static production files. It performs advanced tree-shaking (dead-code elimination) and automated code-splitting, ensuring that your final user-facing JavaScript files are as small and fast to download as possible.Best Practices for Scaling a React-Vite AppAs your application grows from a basic template into an enterprise-grade platform, implementing these strategic configurations will ensure your environment remains optimized:Code-Splitting via React.lazy: Break your application down by page routes using code-splitting. This ensures users only download the JavaScript required for the specific page they are looking at.javascriptimport { lazy, Suspense } from 'react';const Dashboard = lazy(() => import('./pages/Dashboard'));function App() { return ( <Suspense fallback={<div>Loading...</div>}> <Dashboard /> </Suspense> );}Use code with caution.Configure Absolute Path Aliases: Avoid messy relative import paths like ../../../components/Button. Update your vite.config.js with path aliases so you can cleanly import assets using an @ prefix from anywhere in your folder architecture:javascriptimport path from 'path'// Inside your defineConfig object:resolve: { alias: { '@': path.resolve(__dirname, './src'), },}Use code with caution.Conclusion: The Future-Proof ChoiceThe combination of React and Vite represents a massive leap forward for frontend engineering. By abandoning the slow bundling practices of the past and embracing native browser capabilities alongside ultra-fast compilers, Vite delivers a seamless developer experience.It keeps feedback loops instantaneous during coding while generating lightweight, highly performant bundles for production deployment. Embracing this stack gives you a faster, cleaner foundation for building modern web applications.
Descriptive Statistics: The Art and Math of Data Summarization
Jun 10, 2026
8 min read

Descriptive Statistics: The Art and Math of Data Summarization

Descriptive Statistics for Data Science: The Art and Math of Data Summarization. In an era where organizations capture billions of data points daily, raw data is paradoxically both a massive asset and an unmanageable burden. A database filled with millions of customer transactions, sensor readings, or website clicks is functionally useless to a human analyst in its raw, unaggregated form. Before you can deploy complex predictive algorithms or train neural networks, you must first understand the fundamental shape, center, and spread of your data.This is the exact domain of Descriptive Statistics.Descriptive statistics is the branch of mathematics dedicated to objectively summarizing, organizing, and describing the structural features of a specific dataset. Unlike inferential statistics—which uses sample data to make probabilistic guesses about an unmeasured, larger population—descriptive statistics deals strictly with the data you have in hand. It forms the core engine of Exploratory Data Analysis (EDA), providing the essential metrics and visualizations that prevent data scientists from building models on top of flawed, misunderstood, or heavily biased information.The Structural Framework of Descriptive Data AnalysisTo comprehensively describe a dataset, data scientists view information through three distinct mechanical lenses: where the data centers itself, how far it scatters from that center, and the structural shape it takes when plotted. ┌──┐ │ DESCRIPTIVE STATISTICS │ └──┘ │ ┌──┼──┐ ▼ ▼ ▼┌────┐ ┌───┐ ┌───┐│ CENTRAL TENDENCY │ │ DISPERSION │ │ SHAPE & DISTRIBUTION│├──┤ ├─┤ ├─┤│ • Mean (μ) │ │ • Range │ │ • Normal / Skewed││ • Median │ │ • Variance (σ²) │ │ • Skewness ││ • Mode │ │ • Std Dev (σ) │ │ • Kurtosis ││ │ │ • IQR │ │ │└──┘ └───┘ └───┘Part I: Measures of Central Tendency (Finding the Core)Measures of central tendency provide a single, representative value that aims to identify the "center" or the typical anchor point of a data distribution.1. The Arithmetic MeanThe mean is the most common metric used to describe an average. It is computed by summing every individual value in a feature column and dividing that sum by the total number of data points (\(n\)).\(\text{Population\ Mean\ }(\mu )=\frac{\sum {i=1}^{N}X{i}}{N}\)Data Science Application: Calculating the average order value (AOV) on an e-commerce platform or the average response latency of an API server.The Vulnerability: The mean is highly sensitive to extreme values (outliers). For instance, if nine people earning $30,000 sit in a room with one billionaire, the mean income of the room spikes to $100 million. This metric tells an inaccurate story about the "typical" person in that dataset.2. The MedianThe median represents the exact physical midpoint of a dataset when the values are sorted in ascending or descending order. If the dataset has an odd number of observations, the median is the middle number. If it has an even number, it is the average of the two middle numbers.Data Science Application: Analyzing real estate prices or household income.The Strength: The median is highly robust against outliers. In the billionaire example above, the median income remains exactly $30,000, perfectly reflecting the reality of the room's majority.3. The ModeThe mode is the value that appears with the highest frequency in a dataset. A distribution can have one mode (unimodal), two modes (bimodal), or multiple modes (multimodal).Data Science Application: The mode is primarily used for categorical or non-numerical data where calculating a mean or median is mathematically impossible. For example, finding the most popular clothing item size sold, or identifying the most common error code flagged in server logs.Part II: Measures of Dispersion (Quantifying the Spread)Knowing the center of your data only provides half the picture. Two separate groups of users can have an average screen time of exactly 4 hours per day. However, Group A might consistently use the app for 3.5 to 4.5 hours, while Group B might include users who drop off after 5 minutes alongside power users who stay active for 18 hours. Measures of dispersion quantify this variability. Low Variance Distribution High Variance Distribution _|_ ___|___ . | . . | . . | . . | .___________.___.___.___________ ___________.___.___.___________ Spread Spread1. RangeThe simplest measure of spread, calculated by subtracting the minimum value from the maximum value in a dataset. While quick to calculate, it relies entirely on two data points, making it highly unstable if those points happen to be anomalies.2. Variance (\(\sigma ^{2}\))Variance measures the average squared distance of each data point from the dataset's mean. By squaring the differences, variance ensures that negative and positive deviations do not cancel each other out, while simultaneously penalizing larger deviations.\(\text{Sample\ Variance\ }(s^{2})=\frac{\sum {i=1}^{n}(X{i}-\={X})^{2}}{n-1}\)3. Standard Deviation (\(\sigma \))Because variance squashes numbers into squared units (e.g., "squared dollars" or "squared kilometers"), it can be highly unintuitive to interpret. Taking the square root of the variance yields the Standard Deviation, converting the metric back into the data's original unit of measurement.Data Science Application: Setting threshold baselines for anomaly detection. If a metric scales past three standard deviations from the historical mean, a data pipeline can flag it automatically as an abnormal system event.4. Interquartile Range (IQR) and PercentilesPercentiles divide a sorted dataset into 100 equal parts. The 25th percentile is the First Quartile (\(Q_{1}\)), the 50th percentile is the Median (\(Q_{2}\)), and the 75th percentile is the Third Quartile (\(Q_{3}\)).The Interquartile Range is calculated as:\(\text{IQR}=Q_{3}-Q_{1}\)The IQR encapsulates the middle 50% of your data. Data scientists use the IQR to systematically prune datasets of noise via the 1.5 \(\times \) IQR Rule. Any data point that sits below \(Q_1 - 1.5(\text{IQR})\) or above \(Q_3 + 1.5(\text{IQR})\) is statistically defined as an outlier and isolated for closer inspection.Part III: Measures of Distribution ShapeOnce central tendency and dispersion are mapped, a data scientist must look at the overall morphology of the distribution curve.┌───┐│ DISTRIBUTION MORPHOLOGY │├───┬───┬───┤│ LEFT (NEGATIVE) SKEW │ SYMMETRIC (NORMAL) │ RIGHT (POSITIVE) │├──┼──┼───┤│ • Tail extends left │ • Perfectly balanced │ • Tail extends ││ • Mean < Median < Mode │ • Mean = Median = Mode │ • Mode < Median < │└───┴────┴──┘1. SkewnessSkewness quantifies the asymmetry of a data distribution around its mean.Right (Positive) Skew: The distribution tail extends further toward higher values on the right side. The mean is pulled out by these high values, resulting in a mathematical relationship where \(\text{Mode} < \text{Median} < \text{Mean}\). (e.g., Wealth distribution, app download counts).Left (Negative) Skew: The tail extends further toward lower values on the left side. Here, the mean is pulled down, creating a pattern where \(\text{Mean} < \text{Median} < \text{Mode}\). (e.g., Age of retirement, student test scores on an easy exam).2. KurtosisKurtosis measures the "tailedness" of a distribution, indicating how much of the dataset's variance is driven by extreme, infrequent outliers versus routine data points.Leptokurtic (High Kurtosis): A sharp, skinny peak with fat tails. This indicates a high concentration of data around the center, but an increased likelihood of extreme outlier anomalies.Platykurtic (Low Kurtosis): A flat, broad peak with thin tails. This indicates that values are distributed more uniformly across the range with fewer sudden spikes.The Visual Translators of Descriptive StatisticsRaw metrics gain clear, actionable business context when paired with exploratory data visualization assets. Data science pipelines rely heavily on three specific plot archetypes to communicate descriptive statistics:Histograms: Continuous data columns are split into discrete "bins" along the X-axis, with the height of each bar representing the density or count of data points. Histograms instantly reveal the skewness and modality of a dataset.Box Plots (Whisker Plots): A visual representation of the five-number summary: Minimum, \(Q_{1}\), Median, \(Q_{3}\), and Maximum. Box plots highlight the exact boundaries of the IQR and place visual dots beyond the "whiskers" to explicitly mark outliers.Scatter Plots: Used when comparing two distinct numerical fields simultaneously. By mapping one variable to the X-axis and another to the Y-axis, scatter plots map the correlation direction, density clusters, and relational strength between variables.Why Machine Learning Fails Without Descriptive StatisticsSkipping descriptive statistical analysis during the early stages of a project often introduces silent, systemic errors into machine learning pipelines.1. The Hazard of Data Leakage and Missing ValuesIf a column contains missing data points (NaN), many algorithms will crash or ignore the entire row. Data scientists handle this through an engineering phase called Imputation, where missing blocks are filled with statistical substitutes. If the distribution of that column is perfectly symmetric, you can safely impute missing boxes with the Mean. However, if the distribution has a heavy right-hand skew, imputing with the mean will introduce an artificial upward bias into the data. In that scenario, the Median must be used instead.2. Feature Scaling RequirementsAlgorithms like Support Vector Machines (SVM), K-Means Clustering, and Principal Component Analysis (PCA) rely on calculating spatial distances between coordinates. If one feature column tracks passenger age (ranging from 1 to 80) and another tracks annual income (ranging from $20,000 to $5,000,000), the income column’s massive variance will completely overwhelm the model.[Raw Features: Age (1-80), Income (20k-5M)] ──► [Descriptive Summary (μ, σ)] ──► [Z-Score Standardization] ──► [Balanced Model Training]By computing the descriptive mean (\(\mu \)) and standard deviation (\(\sigma \)) of each feature during EDA, engineers can execute Z-Score Standardization:\(Z=\frac{X-\mu }{\sigma }\)This mathematical transformation rescales every variable onto a standardized scale centered at 0 with a standard deviation of 1, allowing the model to weigh both features with equal algorithmic importance.Conclusion: The Base of the Analytical PyramidDescriptive statistics is far more than a collection of elementary math formulas; it is the vital translator that converts confusing raw inputs into a clean, logical narrative structure. By mapping central tendency, evaluating the dispersion of values, and visualizing distribution vectors, data scientists can identify recording anomalies, clean messy features, and validate structural assumptions.Mastering the metrics of descriptive summarization ensures your data products are built on a clear, mathematically sound foundation before moving toward advanced predictive modeling.
Introduction to Statistics for Data Science
Jun 10, 2026
7 min read

Introduction to Statistics for Data Science

Introduction to Statistics for Data Science: The Foundational Language of Data. In the modern technological landscape, data science is often romanticized through the lens of complex machine learning architectures, deep neural networks, and generative artificial intelligence. However, stripping away the algorithmic layers reveals that the core operating engine of data science is built entirely on statistics.Data science is the practice of extracting actionable insights from data, and statistics is the formal language that allows us to do so accurately. Without a solid understanding of statistics, data scientists run the risk of mistaking random noise for meaningful patterns, building biased predictive models, and drawing flawed conclusions.This comprehensive guide serves as an entry point into statistics for data science, mapping out the fundamental concepts—from basic summary metrics to advanced probabilistic frameworks—needed to turn raw variables into strategic assets.Part I: The Two Pillars of StatisticsStatistical analysis is broadly divided into two primary disciplines: Descriptive Statistics and Inferential Statistics. A data scientist must master both to move from simply describing what has happened to predicting what will happen next. ┌────┐ │ STATISTICS FOR DATA SCIENCE │ └─┬──┘ │ ┌──┴──┐ ▼ ▼┌───┐ ┌───┐│ DESCRIPTIVE STATISTICS │ │ INFERENTIAL STATISTICS │├─┤ ├─┤│ • Central Tendency │ │ • Hypothesis Testing ││ • Dispersion / Variance │ │ • Confidence Intervals ││ • Shape of Distribution │ │ • Regression Modeling │└───┘ └──┘1. Descriptive StatisticsDescriptive statistics focus on summarizing and organizing a dataset so its core characteristics are immediately apparent. It acts as the initial step in Exploratory Data Analysis (EDA).Measures of Central TendencyThese metrics help identify the "center" or typical value of a data distribution:Mean: The arithmetic average of all data points. It is highly sensitive to outliers.Median: The exact middle value when data points are sorted in ascending order. It is highly robust against skewed data.Mode: The most frequently occurring value in the dataset, which is useful for categorical variables.Measures of Dispersion (Spread)Understanding the spread of your data is just as vital as finding its center. Two datasets can have the exact same mean but entirely different distributions.Range: The difference between the highest and lowest values in a dataset.Variance (\(\sigma ^{2}\)): The average of the squared differences from the mean. It quantifies how much the data points drift from the center.Standard Deviation (\(\sigma \)): The square root of the variance. It translates the dispersion metric back into the original unit of measurement, making it highly interpretable.Interquartile Range (IQR): The distance between the 25th percentile (Q1) and the 75th percentile (Q3). Data scientists use IQR heavily to identify and isolate anomalies and outliers via boxplots.Part II: Probability and Data DistributionsData is rarely uniform. It takes on various shapes when plotted, and these shapes—known as distributions—dictate the mathematical assumptions a data scientist can make about their models. Standard Normal Distribution (68-95-99.7 Rule) | . | . . | . . | . . | . _______.___.___.___.___________.___.___.___._______ -3σ -2σ -1σ μ 1σ 2σ 3σ |___________|___________| 68% |___________________| 95% |_______________________________| 99.7%1. The Normal (Gaussian) DistributionThe Normal Distribution is the cornerstone of classical statistics. It forms a perfectly symmetrical "bell curve" where the mean, median, and mode are all equal.Data scientists rely on the Empirical Rule (68-95-99.7 Rule) to understand variables that follow this distribution:68% of all data points fall within one standard deviation (\(\pm1\sigma\)) of the mean.95% of all data points fall within two standard deviations (\(\pm2\sigma\)) of the mean.99.7% of all data points fall within three standard deviations (\(\pm3\sigma\)) of the mean.Many real-world phenomena—such as human heights, standardized test scores, and even the errors generated by machine learning models—naturally follow a normal distribution.2. Other Key Distributions in Data ScienceBinomial Distribution: Measures the probability of a binary outcome (success/failure) across a fixed number of independent trials. It is used to analyze conversions, like whether a user will click an ad or close the tab.Poisson Distribution: Calculates the probability of a given number of events occurring within a fixed interval of time or space. It helps optimize systems like server traffic or customer queue lengths.Uniform Distribution: Occurs when all outcomes have an equal probability of happening, such as rolling a fair die or generating a random number within a specific range.Part III: Inferential Statistics and Hypothesis TestingInferential statistics allows data scientists to take a small sample of data and draw conclusions about a much larger population. This is where business experimentation, such as A/B testing, derives its legitimacy.1. The Central Limit Theorem (CLT)The Central Limit Theorem is the foundational bridge between descriptive and inferential statistics. It states that if you take sufficiently large samples from any population, the distribution of the sample means will approach a normal distribution, regardless of the shape of the original population.This theorem allows data scientists to make confident inferences about highly skewed population data using parametric models, provided the sample size is large enough (typically \(n \ge 30\)).2. The Architecture of Hypothesis TestingHypothesis testing is a structured framework used to determine whether a specific data pattern occurred due to an actual cause or simply by random chance.┌─────┐│ HYPOTHESIS TESTING FRAMEWORK │├───┬─────┤│ NULL ($H_0$) │ ALTERNATIVE ($H_1$) │├───┼──┤│ • Status quo │ • The effect is real ││ • No change or effect │ • Statistically meaningful ││ • Observed by pure chance │ • Target of the experiment │└──┴───┘Null Hypothesis (\(H_{0}\)): The default assumption that there is no significant difference or effect. Any observed change is due to random variance.Alternative Hypothesis (\(H_{1}\)): The statement you want to prove. It asserts that the observed difference is real and caused by a specific variable.3. P-Values and Significance Levels (\(\alpha \))To choose between the Null and Alternative hypotheses, data scientists look at the p-value:Significance Level (\(\alpha \)): The threshold for risk, typically set at \(0.05\) (\(5\%\)). It represents the probability of rejecting the null hypothesis when it was actually true (a Type I error).The Decision Rule: If the computed p-value is less than or equal to \(\alpha \) (\(p \le 0.05\)), the result is considered statistically significant. You reject the Null Hypothesis and accept the Alternative. If the p-value is higher, you fail to reject the null hypothesis.Part IV: Quantifying Relationships (Correlation vs. Causation)A significant portion of predictive modeling involves understanding how different variables interact with one another.1. Correlation Coefficient (\(r\))Pearson’s correlation coefficient measures the linear strength and direction of the relationship between two continuous variables. The metric ranges strictly between \(-1\) and \(+1\):\(+1\): A perfect positive linear relationship (as \(X\) increases, \(Y\) increases proportionally).\(0\): Absolute zero linear relationship between the variables.\(-1\): A perfect negative linear relationship (as \(X\) increases, \(Y\) decreases proportionally). Positive Correlation (+1) Negative Correlation (-1) * * * * * * * * * * * * * *2. The Causation FallacyOne of the most vital rules in data science is that correlation does not imply causation. Two variables can follow identical mathematical trends due to an unmeasured third factor (a confounding variable) or pure coincidence.For example, ice cream sales and sunburn rates are highly correlated, but buying ice cream does not cause a sunburn. Both are driven by a third variable: hot summer weather. Data scientists must use randomized controlled experiments to prove actual causality.Part V: Statistics in Practical Machine LearningStatistical principles directly govern how machine learning models learn, make predictions, and handle errors.1. The Bias-Variance TradeoffWhen training a predictive model, statistics helps us balance two types of errors:Bias: Errors caused by oversimplified assumptions in the model. High bias leads to underfitting, where the model fails to capture the underlying patterns in the training data.Variance: Errors caused by overcomplicating the model. High variance leads to overfitting, where the model learns the training data's random noise so perfectly that it fails to generalize to fresh, unseen data.┌──────┐│ THE MODEL FIT SPECTRUM │├──┬──┬──┤│ UNDERFITTING │ GOOD FIT │ OVERFITTING │├──┼───┼──┤│ • High Bias │ • Optimal Balance │ • High Variance││ • Low Variance │ • Low Total Error │ • Low Bias ││ • Missing trends │ • Generalizes well│ • Learns noise │└───┴───┴───┘2. Feature Selection and DimensionalityIn big data environments, datasets often contain hundreds of columns (features). Data scientists use statistical techniques like Variance Inflation Factors (VIF), Chi-Square tests, and Principal Component Analysis (PCA) to eliminate redundant features. This process streamlines datasets, speeds up model training times, and prevents errors associated with multicollinearity.Conclusion: Elevating Data Science Beyond AlgorithmsAlgorithms provide machine learning models with their muscle, but statistics provides them with their sight. No matter how advanced your programming pipelines become, the validity of your data products relies on foundational statistics.By understanding how data distributions behave, implementing rigorous hypothesis tests, and recognizing the spread and limitations of your metrics, you ensure that your data science conclusions are mathematically sound, highly repeatable, and reliable in production environments.
 How UAPs, the USA, and Alien Tech Could Spark the Next Industrial Revolution
Jun 10, 2026
9 min read

How UAPs, the USA, and Alien Tech Could Spark the Next Industrial Revolution

The Cosmic Assembly Line: How UAPs, the USA, and Alien Tech Could Spark the Next Industrial Revolution. For generations, the conversation surrounding Unidentified Anomalous Phenomena (UAPs)—historically known as UFOs—and extraterrestrial life was confined to the fringes of science fiction and late-night conspiracy radio. However, a historic paradigm shift has unfolded. What was once dismissed as folklore has entered the halls of the United States Congress, intelligence agencies, and elite scientific institutions.The debate is no longer just about whether "we are alone." Instead, it centers on a far more disruptive question: If the United States government or private aerospace entities possess non-human technology, how will it reshape human civilization?Historically, every industrial revolution has been triggered by the mastery of a new energy source or thermodynamic mechanism. The First Industrial Revolution was born of coal and steam; the Second, of electricity and oil; the Third, of silicon and computing; and the Fourth, of automation, AI, and biotechnology. If the exotic physical properties observed in UAPs can be reverse-engineered, humanity stands on the precipice of a Fifth Industrial Revolution—one driven by quantum propulsion, limitless zero-point energy, and trans-medium materials.Part I: The United States and the Declassification CascadeTo understand how alien technology could dictate the future of global industry, one must first look at the epicenter of UAP disclosure: the United States.[1947: Roswell Era] ──> [2017: NYT ATIP Leak] ──> [2023: Congressional Hearings] ──> [Present: Institutionalization]For decades, the official stance of the U.S. government was one of total denial. This wall of secrecy began to fracture in December 2017, when The New York Times exposed the existence of the Pentagon’s Advanced Aerospace Threat Identification Program (AATIP), accompanied by declassified infrared videos of naval pilots encountering "Tic-Tac" shaped objects. These objects exhibited physics-defying capabilities: instantaneous acceleration, hypersonic speed without sonic booms, and the ability to transition seamlessly between space, air, and water (trans-medium travel).The turning point occurred during sworn congressional testimony by highly decorated former intelligence officer David Grusch. Grusch alleged that the U.S. executive branch and private defense contractors had spent decades operating a covert, multi-decade UAP crash-retrieval and reverse-engineering program.The institutional response was swift. The U.S. House of Representatives formed bipartisan oversight committees, passing the UAP Disclosure Act components into the National Defense Authorization Act (NDAA). NASA established an independent UAP study team, and the Pentagon formed the All-domain Anomaly Resolution Office (AARO). UFOs were officially rebranded as UAPs, transitioning from a cultural joke to a matter of national security and aerospace safety.The primary geopolitical driver for this sudden transparency is a fear of technological surprise. If the United States possesses craft or materials of non-human origin, it is highly probable that geopolitical rivals like China and Russia are pursuing similar retrieval operations. The nation that first unlocks the operational physics of these anomalies will achieve absolute technological and industrial hegemony over the planet.Part II: The Physics of the "Five Observables"To project how this technology will fuel a future industrial revolution, we must analyze the specific mechanical anomalies documented by military sensors. The Pentagon characterizes UAPs using five distinct behaviors, known as the "Five Observables":Anti-Gravity Lift: Craft hovering effortlessly without wings, rotors, or visible thermal exhaust signatures.Sudden and Instantaneous Acceleration: Objects accelerating from a dead stop to Mach 20+ without crushing pilots or tearing apart under extreme G-forces.Hypersonic Velocity without Signatures: Traveling at extreme speeds through the atmosphere without generating sonic booms or friction-induced thermal tracks.Trans-Medium Travel: Moving interchangeably through space, air, and oceans without losing velocity or experiencing hydrodynamic drag.Low Observability: Evading radar tracking, infrared targeting, and visual sight lines via active camouflage or optical bending. [UAP METAMATERIAL CORE] │ ┌───┴───┐ ▼ ▼[Gravitational Wave Field] [Plasma Engineering] │ │ ├─► Inertia Cancellation ├─► Zero Friction └─► Spacetime Warping └─► Trans-Medium FlightThese capabilities violate our current understanding of classical thermodynamics and material science. To achieve these feats, a craft cannot rely on chemical combustion. Instead, it must manipulate the fabric of spacetime or utilize advanced plasma engineering.For instance, if a craft can generate a localized gravitational field or cancel its own mass (inertia cancellation), it would not experience the laws of friction or inertia. Inside this localized "bubble," a payload or pilot would experience zero Gs during a sharp 90-degree turn at supersonic speed, because the space surrounding the craft moves with it.Part III: Blueprint for the Fifth Industrial RevolutionThe commercialization of non-human physics would alter the structure of global markets, rendering fossil fuels, traditional logistics, and conventional metallurgy obsolete.┌────┐│ THE FIFTH INDUSTRIAL REVOLUTION │├──┬───┬──┤│ ENERGY │ PROPULSION │ MATERIALS │├──┼──┼──┤│ • Zero-Point │ • Gravitational │ • Metamaterials││ • Fusion Cores │ • Mass-Cancelled │ • Atomic Mesh ││ • Gridless Power │ • Interplanetary │ • Auto-Healing │└──┴───┴────┘1. The Energy Paradigm: The Death of ScarcityEvery factory, cargo ship, and data center on Earth is bound by the cost of electricity and fuel. UAPs operate on self-contained, long-duration power sources that generate gigawatts of energy without emission or refueling.If human engineers unlock this power source—whether it relies on controlled cold fusion, element-stable antimatter, or tapping into quantum vacuum fluctuations (zero-point energy)—the global energy crisis ends overnight.Industrial Impact: Desalination plants could run continuously for pennies, turning deserts into arable land. Heavy manufacturing, chemical synthesis, and vertical farming would face near-zero operational energy costs, decoupling economic growth from ecological degradation.2. Advanced Logistics and Trans-Medium Supply ChainsThe global economy is built on shipping lanes, rail networks, and air freight. A trans-medium propulsion system renders geographic barriers irrelevant.Industrial Impact: A cargo ship moving across the Atlantic at 20 knots would be replaced by sub-orbital, heavy-lift transport containers capable of moving freight from Lagos to New York in under ten minutes. By eliminating friction, heat signatures, and aerodynamic drag, transportation costs plummet to near zero. Supply chains would shift from localized or regional setups to an instantaneous planetary web.3. Metamaterials and Atomic EngineeringAnalysis of alleged UAP fragments recovered by the U.S. government reveals highly complex, layered metamaterials. These are substances engineered at the atomic scale with structures not found in nature, such as alternating micro-layers of bismuth, magnesium, and zinc.Industrial Impact: These materials act as waveguides for electromagnetic energy, allowing for super-conductivity at room temperature and the redirection of gravitational waves. The future of manufacturing will transition from raw chemical processing to atomic-level printing. We will manufacture metals that are lighter than plastic yet stronger than titanium, capable of healing their own structural fractures under stress.4. The Deep Space Industrial SectorHumanity’s current space industry is bottle-necked by the high cost of chemical rockets. Escaping Earth’s gravity well requires millions of gallons of volatile fuel to lift modest payloads.Industrial Impact: With anti-gravity or mass-canceling propulsion, leaving Earth's atmosphere becomes as routine as driving a car. This triggers the expansion of off-world mining operations. The asteroid belt, rich in platinum, gold, cobalt, and rare earth elements, becomes accessible. Rather than damaging Earth's ecosystems via open-pit mining, heavy extraction industries will shift entirely into deep space, transforming Earth into a protected residential and ecological zone.Part IV: The Geopolitical and Economic Friction of DisclosureWhile the technological benefits of an alien-tech-driven industrial revolution are immense, the transition would be highly volatile. A sudden injection of paradigm-shattering technology into a fragile global economy would trigger massive institutional friction.[Technology Injection] ──► [Fossil Fuel Collapse] ──► [Geopolitical Power Shift] ──► [Market Re-Stabilization]The Petrodollar and Financial System CollapseThe current geopolitical order is underpinned by the energy sector. Trillions of dollars in banking infrastructure, sovereign wealth funds, and national economies are tied directly to oil, natural gas, and coal. If a clean, self-contained energy alternative derived from UAP technology is made public, the fossil fuel industry would face immediate obsolescence. Whole nations whose economies rely on oil exports could face financial collapse, destabilizing global financial markets and fiat currencies.Intellectual Property and Corporate MonopoliesA hidden battle is playing out between the U.S. Department of Defense and private defense contractors (such as Lockheed Martin, Northrop Grumman, and Raytheon). Historically, legacy aerospace firms were given access to recovered UAP materials under strict "Need-to-Know" classifications to prevent foreign espionage.If this technology is commercialized, who owns the patents? If a single defense contractor holds a patent on a room-temperature superconductor or a gravity-distortion drive, they would instantly become more powerful than most sovereign governments, creating an unprecedented corporate monopoly.The Weaponization RiskThe industrial capabilities required to build a trans-medium propulsion drive are identical to those required to build a weapon of absolute destruction. An object capable of moving at Mach 20 and shifting instantly without mass can be weaponized as a kinetic missile against which there is no defense. The United States government faces a profound dilemma: Disclosing the technology to accelerate the industrial revolution also risks proliferating blueprints for weapons capable of vaporizing entire cities with zero warning.Conclusion: Preparing for the Post-Disclosure EconomyThe intersection of UAPs, the United States' shifting policy toward transparency, and the future of production indicates that humanity is approaching a defining threshold. The Fourth Industrial Revolution, with its focus on artificial intelligence, may simply serve as the foundational infrastructure required to manage the massive data streams and complex engineering matrix of the Fifth.To navigate this transition without societal collapse, the United States and the broader global community must design open-source, international frameworks for the study of anomalous materials. Shifting this research out of compartmentalized, military black-budgets and into public academia will ensure that the resulting industrial benefits are democratized rather than hoarded by military-industrial monopolies.The future of industry is not merely about optimizing our current tools; it is about rewriting our relationship with energy, gravity, and space. As the veil of secrecy continues to lift in Washington, humanity must prepare for a marketplace that extends far beyond the confines of Earth. The cosmic assembly line is opening, and the societies that adapt to its physics will shape the next millennium of human history.
Responsive Interfaces: An Introduction to the Bootstrap CSS Framework
Jun 09, 2026
8 min read

Responsive Interfaces: An Introduction to the Bootstrap CSS Framework

Crafting Responsive Interfaces: An Introduction to the Bootstrap CSS Framework. In the early days of web development, building a website that looked good on both a desktop monitor and a mobile phone required writing massive, complex style sheets from scratch. Developers spent countless hours wrestling with CSS floats, media queries, and browser compatibility bugs just to align a basic navigation bar or button grid.This landscape shifted dramatically in August 2011 when Mark Otto and Jacob Thornton, two developers at Twitter, released Bootstrap as an open-source project. Originally designed as an internal tool to ensure design consistency across Twitter’s corporate applications, Bootstrap quickly grew into the most popular front-end framework in the world.Today, Bootstrap serves as the foundation for millions of websites. This introduction will explore what Bootstrap is, look at its core architecture, examine its powerful grid system, and show you how to build modern web interfaces using this open-source tool.1. What is Bootstrap?At its core, Bootstrap is a free, open-source front-end framework consisting of pre-compiled CSS and JavaScript templates. It provides web developers with an extensive kit of ready-to-use user interface (UI) components—such as buttons, forms, navigation bars, cards, modal windows, and carousels.+-------------------------------------------------------------+| BOOTSTRAP ENGINE |+-------------------------------------------------------------+ | | | v v v[ Responsive Grid ] [ Pre-built UI Components ] [ Utility Classes ]- Flexbox-based - Navbar, Cards, Buttons - Spacing (m-3, p-2)- 12-column layout - Modals & Dropdowns - Typography & ColorsInstead of writing custom CSS rules to style a webpage from scratch, developers simply download Bootstrap and apply pre-defined class names to standard HTML elements.Why Use a CSS Framework?Rapid Development Speed: Instead of designing a polished button or navigation bar layout from the ground up, you can build a complete, production-ready prototype in minutes using Bootstrap's components.Responsive Design by Default: Every element within Bootstrap is built with mobile responsiveness in mind. Your website automatically scales down for smartphones, layout structures shift for tablets, and columns expand gracefully on high-resolution monitors.Cross-Browser Consistency: Different web browsers (Chrome, Safari, Firefox, Edge) occasionally render raw CSS properties differently. Bootstrap includes a CSS normalization baseline called Reboot that smooths over these browser inconsistencies, ensuring your application looks uniform everywhere.Massive Community Ecosystem: Because Bootstrap is so widely adopted, finding templates, tutorials, and third-party plugins is effortless.2. Core Architecture and Mobile-First PhilosophyUnderstanding Bootstrap requires embracing a mobile-first design philosophy. In older web design models, developers built a comprehensive desktop site first, then used media queries to hide or compress elements for smaller screens.Bootstrap flips this approach upside down. Its styles are written for the smallest screens first (smartphones), and then progressively enhanced for larger screen viewports using minimum-width (min-width) media queries. This logic optimizes mobile performance by preventing smaller devices from processing bulky desktop-centric styles.The Breakpoints BlueprintBootstrap segments different device screen widths into logical brackets called breakpoints. These breakpoints correspond to standard device viewports and are controlled by shorthand class modifiers:BreakpointClass AbbreviationDimensionsTarget DeviceExtra SmallNone< 576pxPortrait SmartphonesSmallsm≥ 576pxLandscape SmartphonesMediummd≥ 768pxTabletsLargelg≥ 992pxLaptops / Smaller MonitorsExtra Largexl≥ 1200pxDesktop MonitorsExtra Extra Largexxl≥ 1400pxUltra-wide Displays3. The Heart of Bootstrap: The 12-Column Grid SystemThe single most powerful feature of Bootstrap is its responsive grid system. Built on top of CSS Flexbox layout logic, the grid uses a series of containers, rows, and columns to align content.The system divides the horizontal width of a webpage into 12 equal, invisible columns. Developers choose how many of these columns a specific element should occupy.+-----------------------------------------------------------------------+| .container || +-----------------------------------------------------------------+ || | .row | || | +---------------+ +---------------+ +---------------+ | || | | .col-md-4 | | .col-md-4 | | .col-md-4 | | || | | (Takes 4 cols)| | (Takes 4 cols)| | (Takes 4 cols)| | || | +---------------+ +---------------+ +---------------+ | || +-----------------------------------------------------------------+ |+-----------------------------------------------------------------------+The Grid Components1. Containers (.container or .container-fluid)Containers are the outer structural walls of your layout. A regular .container centers your content on the page and applies fixed widths based on the active breakpoint. A .container-fluid spans the full width of the screen, edge to edge.2. Rows (.row)Rows act as horizontal wrappers that sit inside containers. Rows ensure that your individual columns stack neatly next to each other.3. Columns (.col-*)Columns are where your actual text, images, and components live. Columns must always be direct children of a .row.A Practical Grid Layout ExampleConsider a scenario where you want to display three feature boxes side-by-side on a desktop computer, but you want them to stack on top of each other when viewed on a phone. The HTML code looks like this:html<div class="container"> <div class="row"> <div class="col-12 col-md-4"> <h3>Feature A</h3> <p>This is the first feature box description.</p> </div> <div class="col-12 col-md-4"> <h3>Feature B</h3> <p>This is the second feature box description.</p> </div> <div class="col-12 col-md-4"> <h3>Feature C</h3> <p>This is the third feature box description.</p> </div> </div></div>Use code with caution.Deconstructing the Codecol-12: By default, on mobile screens (extra-small viewports), each box will take up all 12 available columns, forcing them to stack vertically.col-md-4: When the viewport expands to a medium screen size (tablets and laptops, ≥ 768px), the layout switches engine rules. Each box now takes up exactly 4 columns. Because 4 + 4 + 4 = 12, all three feature boxes align side-by-side across a single row.4. Exploring Essential ComponentsBootstrap includes dozens of pre-designed interface modules. By leaning on these components, you don't have to spend hours writing custom styles for common web UI features.Navigation Bars (.navbar)The navigation bar is a staple of modern web design. Bootstrap's navbar component includes automated mobile collapse logic out of the box. On desktop viewports, it displays a standard horizontal navigation bar with links and dropdowns. On a smartphone screen, it automatically collapses behind a standard "hamburger" icon menu, expanding smoothly when tapped.Cards (.card)Cards serve as clean, flexible data containers. They group related information together by combining headers, text, contextual buttons, and cover images inside a cleanly bordered box. Cards are widely used to display blog article loops, e-commerce product grids, or profile dashboards.html<div class="card" style="width: 18rem;"> <img src="product.jpg" class="card-img-top" alt="Product Image"> <div class="card-body"> <h5 class="card-title">E-Commerce Product</h5> <p class="card-text">A high-quality product description paragraph goes here.</p> <a href="#" class="btn btn-primary">Buy Now</a> </div></div>Use code with caution.Utility ClassesIn addition to large components, Bootstrap provides thousands of tiny, single-purpose helper styles called Utility Classes. These let you adjust padding, margins, colors, and borders instantly without writing a single line of custom CSS.m-3 / p-2: Applies an all-around margin level of 3 or padding level of 2.text-center: Automatically shifts your text alignment to the center.bg-dark text-white: Inverts an element into a dark-themed container with white text.5. Integrating Bootstrap into a ProjectThere are two primary ways to add Bootstrap to a web development project.Approach 1: Using a Content Delivery Network (CDN) - Quickest MethodIf you are building a simple website or a quick prototype, you can link to Bootstrap’s files directly from a public server by adding two lines of code to your HTML file:html<!DOCTYPE html><html lang="en"><head> <meta charset="UTF-8"> <meta name="viewport" content="width=device-width, initial-scale=1.0"> <title>Bootstrap Quickstart</title> <!-- Bootstrap Compiled CSS Link --> <link href="https://jsdelivr.net" rel="stylesheet"></head><body> <div class="container mt-5"> <h1 class="text-primary">Hello, Bootstrap!</h1> <button class="btn btn-success">Success Button</button> </div> <!-- Bootstrap JS Bundle Link (Includes Popper.js for dropdowns/modals) --> <script src="https://jsdelivr.net"></script></body></html>Use code with caution.Approach 2: Using a Package Manager (NPM) - Professional MethodFor large, enterprise-level web applications, developers install Bootstrap directly into their project environment via terminal package managers:bashnpm install bootstrap Use code with caution.This local installation allows developers to open Bootstrap’s source Sass files, modify global theme colors (such as changing the default blue brand color to a custom corporate green), and strip out unused modules to make production bundle file sizes as light as possible.6. ConclusionBootstrap revolutionized front-end web development by proving that responsive, consistent UI design doesn't require reinventing the wheel for every new project. By offering a robust 12-column flexbox grid, an extensive library of accessible UI components, and intuitive utility helper classes, it empowers developers to build production-ready applications with remarkable speed.While modern CSS advancements like native Grid and Flexbox give developers more layout control than ever before, Bootstrap remains a valuable asset for quick prototyping, building internal corporate tools, and providing an organized design system for large dev teams.
Chi-Square Calculations in PSPP: A Step-by-Step Guide
Jun 09, 2026
10 min read

Chi-Square Calculations in PSPP: A Step-by-Step Guide

Master Chi-Square Calculations in PSPP: A Step-by-Step Guide with Practical Examples. In statistical analysis, understanding relationships between categorical variables is a fundamental requirement across disciplines—ranging from public health and marketing research to social sciences and quality control. While commercial software packages like IBM SPSS are widely used for this purpose, their steep licensing costs often present a barrier to students, independent researchers, and non-profit organizations.Fortunately, PSPP offers a powerful, completely free, and open-source alternative. Designed as a drop-in replacement for SPSS, PSPP replicates its user interface, command syntax, and data handling logic.This comprehensive guide will walk you through the theory and practical execution of Chi-Square (\(\chi ^{2}\)) tests using PSPP. We will explore both the Goodness-of-Fit Test and the Test of Independence using clear, step-by-step examples.1. Understanding the Core Concepts of Chi-Square TestsBefore opening PSPP, it is critical to understand what a Chi-Square test does and when it should be applied. Chi-Square tests are non-parametric statistics, meaning they do not assume your data follows a normal distribution curve. Instead, they operate purely on frequencies (counts) within nominal or ordinal categorical data.There are two primary flavors of the Chi-Square test, each answering a distinct research question:A. The Chi-Square Goodness-of-Fit TestThis test evaluates a single categorical variable. It determines whether the observed distribution of data points across various categories matches an expected distribution (such as an equal split or a distribution derived from historical census data).Research Question Example: Does a retail store attract an equal number of customers on every day of the week?B. The Chi-Square Test of Independence (Crosstabulation)This test evaluates two categorical variables simultaneously. It determines whether there is a statistically significant association between them, essentially checking if the distribution of one variable depends on the categories of the second variable.Research Question Example: Is there a relationship between a person’s employment status (Employed vs. Unemployed) and their preferred mode of public transit (Bus, Train, or Taxi)?Crucial Assumptions for All Chi-Square TestsTo ensure your PSPP output is valid, your dataset must meet these core assumptions:Categorical Data: Variables must be nominal (e.g., gender, region) or ordinal (e.g., satisfaction level: low, medium, high).Independence of Observations: Each subject or data point must occupy exactly one cell. You cannot have the same person counted multiple times across different categories.Adequate Sample Size: A classic rule of thumb is that the expected frequency in any given cell should be 5 or greater for at least 80% of the cells. If your expected counts are too low, the test loses statistical power and accuracy.2. Preparing and Structuring Data in PSPPTo follow along with our upcoming examples, you must understand how data can be entered into PSPP. PSPP allows for two distinct entry formats: Raw Individual Data and Weighted Aggregated Data.Approach A: Entering Raw Individual DataIn this format, each row in your PSPP Data View represents a single, unique participant or observation. If you surveyed 150 people, your spreadsheet will have exactly 150 rows.Example Columns: Participant_ID, Gender, Job_Satisfaction.Approach B: Entering Weighted Aggregated Data (Time-Saver)If you already possess a summarized tally table (e.g., from a report), you do not need to manually type 150 rows. Instead, you create a summary grid with a dedicated Weight Variable.Example Columns: Gender, Job_Satisfaction, and Count.How to Activate Weighting in PSPP:If using Approach B, you must explicitly tell PSPP to treat your count column as a multiplier.Navigate to the top menu and select Data \(\rightarrow \) Weight Cases...In the dialog box that appears, select the radio button for Weight cases by.Move your summary frequency variable (e.g., Count) into the Frequency Variable slot.Click OK. A small indicator reading "Weight On" will appear in the bottom-right status bar of your PSPP window.3. Example 1: Chi-Square Goodness-of-Fit TestScenarioA university student council claims that student enrollment across four major academic tracks—Science, Arts, Business, and Engineering—is perfectly balanced, with an equal 25% distribution in each stream. A researcher collects a random sample of 200 students to test this hypothesis.Hypothesis FormulationNull Hypothesis (\(H_{0}\)): Student enrollment is uniformly distributed across all four academic tracks (Observed Frequencies = Expected Frequencies).Alternative Hypothesis (\(H_{1}\)): Student enrollment is not uniformly distributed across the tracks; a preference pattern exists.Step-by-Step Execution in PSPPStep 1: Variable and Data EntryOpen PSPP and switch to the Variable View tab at the bottom left. Define your variable:Name: TrackType: NumericLabel: Academic TrackValue Labels: Click the cell to define your categories:1 = Science2 = Arts3 = Business4 = EngineeringSwitch to the Data View tab. We will use the weighted frequency method for swift input. Create a second variable named Frequency, turn on Weight Cases, and enter the following counts:Science (1): 65 studentsArts (2): 35 studentsBusiness (3): 40 studentsEngineering (4): 60 students[Data View Layout]Track | Frequency---------------------1.00 | 65.002.00 | 35.003.00 | 40.004.00 | 60.00Step 2: Running the AnalysisGo to the top navigation bar and select: Analyze \(\rightarrow \) Non-Parametric Tests \(\rightarrow \) Chi-Square...A dialog box will open. Select your variable Academic Track [Track] from the left panel and click the arrow button to move it into the Test Variable List.Under the Expected Values section, leave the default option selected: All categories equal (since our null hypothesis tests an equal 25% split).Click OK.+-------+| Chi-Square Test |+--------+| Test Variable List: Expected Values: || +-------+ (x) All categories equal|| | [Track] | ( ) Values: [ ] || +-------+ |+----------+Interpreting the Output WindowPSPP will launch its Output Viewer window containing two primary tables:Table 1: FrequenciesThis table displays your category names alongside three crucial metrics: Observed N (your actual data: 65, 35, 40, 60), Expected N (calculated by dividing the total sample of 200 by 4 categories, yielding 50 per cell), and the Residual (Observed minus Expected).Table 2: Test StatisticsThis contains the mathematical conclusion of your test:Chi-Square Value: \(\chi^2 = 14.00\)Degrees of Freedom (df): Calculated as \(k - 1\) (where \(k\) is the number of categories). \(4 - 1 = 3\).Asymp. Sig. (p-value): This is the most critical number for decision-making. Let us assume it reads 0.003.+-----------------------------------+| Test Statistics |+-----------------------------------+| Chi-Square | 14.000 || df | 3 || Asymp. Sig. | 0.003 |+-----------------------------------+Statistical ConclusionBecause our asymptotic significance value (\(p = 0.003\)) is substantially lower than our standard alpha threshold of \(0.05\), we reject the null hypothesis (\(H_{0}\)).Reporting the result: "A Chi-Square Goodness-of-Fit test indicated that student enrollment was not equally distributed across academic tracks, \(\chi^2(3) = 14.00, p < 0.01\)." The data shows that Science and Engineering tracks have higher enrollment numbers than expected, while Arts and Business lag behind.4. Example 2: Chi-Square Test of Independence (Two Variables)ScenarioA public health organization wants to know whether there is an association between an individual's Physical Activity Level (Sedentary vs. Active) and their self-reported Sleep Quality (Poor, Average, Good). They survey a sample of 300 adults.Hypothesis FormulationNull Hypothesis (\(H_{0}\)): Physical activity level and sleep quality are independent of one another (no relationship exists).Alternative Hypothesis (\(H_{1}\)): Physical activity level and sleep quality are dependent/associated with one another.Step-by-Step Execution in PSPPStep 1: Define VariablesOpen a new dataset tab in PSPP and navigate to Variable View. Configure three distinct variables:Name: ActivityLabel: Physical Activity LevelValue Labels: 1 = Sedentary, 2 = ActiveName: SleepLabel: Sleep QualityValue Labels: 1 = Poor, 2 = Average, 3 = GoodName: CountLabel: Number of Respondents (Remember to apply Data \(\rightarrow \) Weight Cases using this variable!)Step 2: Populate the Data MatrixSwitch over to Data View. Because we have 2 activity levels multiplied by 3 sleep tiers, we must enter all 6 unique combinations along with their aggregated counts:Activity | Sleep | Count------------------------------1 (Seden) | 1 (Poor) | 55.001 (Seden) | 2 (Aver) | 60.001 (Seden) | 3 (Good) | 35.002 (Active) | 1 (Poor) | 25.002 (Active) | 2 (Aver) | 65.002 (Active) | 3 (Good) | 60.00Step 3: Executing the Crosstabs ProcedureNavigate to the top menu option: Analyze \(\rightarrow \) Descriptive Statistics \(\rightarrow \) Crosstabs...A configuration panel will populate.Select Physical Activity Level [Activity] from your variable repository and transfer it to the Row(s) box using the corresponding arrow button.Select Sleep Quality [Sleep] and transfer it into the Column(s) box.Click the Statistics... button located at the bottom of the dialog window. Check the box labeled Chi-square, then click Continue.(Optional but highly recommended) Click the Cells... button. Under Counts, make sure Observed and Expected are both selected. This step helps you easily verify the "minimum cell count of 5" assumption. Click Continue.Click OK to process.+-------+| Crosstabs |+------+| Variables: Row(s): || +-----+ +------+ || | | --> | [Activity] | || +-----+ +----+ || Column(s): || +-----+ || | [Sleep] | || +-----+ || [Statistics...] (Chi-Square checked) |+--------+Interpreting the Output WindowYour PSPP Output Viewer will generate three core panels:1. Case Processing SummaryThis simple tracking card displays the sample breakdown. It confirms that 100% of your 300 targeted analytical cases were safely captured without encountering missing cell exclusions.2. Activity * Sleep CrosstabulationBecause we enabled Expected Counts, each intersection square will contain two data values:Observed Count: The real-world data points we manually entered.Expected Count: What the software calculates assuming no relationship exists between exercise and sleep. For instance, notice that for the Sedentary \(\times \) Poor Sleep intersection, the observed count (55) is noticeably higher than the mathematically expected baseline pattern (40.0).3. Chi-Square Tests TableLook closely at the row header designated as Pearson Chi-Square:+-------+| Chi-Square Tests |+--------+| | Value | df | Asymp. Sig. (2- || | | | sided) |+----+---+---+----+| Pearson Chi-Square | 17.216 | 2 | 0.000 || N of Valid Cases | 300 | | |+--------+Value: The calculated test statistic (\(\chi^2 = 17.216\)).df (Degrees of Freedom): Calculated using the formula \((R - 1) \times (C - 1)\), where \(R\) equals rows and \(C\) equals columns. For our layout: \((2 - 1) \times (3 - 1) = 1 \times 2 = 2\).Asymp. Sig. (2-sided): The calculated probability value (\(p = 0.000\)). Note that in statistical output, 0.000 does not mean zero probability; it means the p-value is extremely small (\(p < 0.001\)).Statistical ConclusionBecause our calculated asymptotic significance value (\(p < 0.001\)) falls comfortably below the critical \(0.05\) threshold, we reject the null hypothesis (\(H_{0}\)).Reporting the result: "A Pearson Chi-Square Test of Independence demonstrated a statistically significant association between an individual's physical activity level and their reported sleep quality, \(\chi^2(2) = 17.22, p < 0.001\)."By cross-referencing our observed versus expected cell counts, we can infer that sedentary individuals experience a disproportionately higher rate of poor sleep quality, whereas active individuals achieve average or good sleep marks at rates higher than expected.5. Troubleshooting Common Errors in PSPPWhen conducting Chi-Square procedures inside PSPP, you may occasionally encounter error notifications or confusing outputs. Use this quick reference guide to resolve common issues:Issue A: The output table displays fractional frequencies (e.g., 23.40 rows)The Cause: You forgot to turn off the Weight Cases tool from a previous analytical run, or you selected an incorrect weighting variable column.The Fix: Go to Data \(\rightarrow \) Weight Cases, choose the radio button for Do not weight cases, and click OK to reset your configuration baseline.Issue B: The Asymptotic Significance value reads completely blank or returns .The Cause: This occurs if your dataset lacks data variation, such as entering data where all respondents select a single option. This results in a matrix with 0 degrees of freedom, making division operations mathematically impossible.The Fix: Double-check your data layout in Data View. Ensure you have entered your value categories and counts correctly across distinct categorical rows.Issue C: A warning note states "Expected values are less than 5"The Cause: Your overall sample size is too small, or your data points are distributed across too many complex categorical choices. This directly violates our minimum cell size assumption.The Fix: You must collect a larger data sample, or combine related low-frequency categories to simplify your matrix. For example, you could merge an "Extremely Dissatisfied" choice category into a broader "Dissatisfied" group using the Transform \(\rightarrow \) Recode into Different Variables utility.
An Introduction to Network Security in Cybersecurity
Jun 09, 2026
9 min read

An Introduction to Network Security in Cybersecurity

Guarding the Digital Perimeter: An Introduction to Network Security in Cybersecurity. In an era where global businesses, government infrastructures, and personal lives are completely intertwined with the internet, data has become the world’s most valuable currency. Every financial transaction, medical record, private conversation, and industrial operations plan travels across digital networks. However, this absolute connectivity introduces massive vulnerability.Cybercriminals, nation-state actors, and malicious insiders constantly search for gaps in digital defenses to steal data, hold systems hostage, or destroy critical infrastructure. This is where network security comes in. As a primary pillar of cybersecurity, network security is the practice of planning, implementing, and monitoring defensive measures to protect a network and its data from unauthorized access, misuse, modification, or destruction.1. Defining Network SecurityTo understand network security, one must first distinguish it from the broader umbrella of cybersecurity.Cybersecurity is an all-encompassing discipline focused on protecting everything in the digital realm—including endpoints, cloud environments, application code, user behaviors, and networks—from digital attacks.Network Security focuses specifically on the infrastructure. It secures the pipelines, connections, and protocols that allow devices to talk to one another.The core mission of network security is universally guided by the CIA Triad: Confidentiality, Integrity, and Availability. [ Confidentiality ] / \ / \ / \ [ Integrity ] --- [ Availability ]ConfidentialityConfidentiality ensures that sensitive data remains hidden from unauthorized eyes while in transit or at rest. Network security achieves this through encryption and strict access controls. If an unauthorized actor intercepts a data packet, encryption ensures they see nothing but unreadable ciphertext.IntegrityIntegrity guarantees that data is not altered, deleted, or tampered with during its journey across the network. Security protocols use cryptographic hashing and digital signatures to verify that a file sent from point A arrives at point B completely unchanged.2. Common Network Security ThreatsBuilding an effective network defense requires a deep understanding of the tactics and tools adversaries use. The threat landscape is highly diverse, ranging from automated opportunistic scans to highly targeted, multi-stage operations.MalwareMalware (malicious software) is an umbrella term for code designed to exploit, damage, or disrupt networks.Viruses and Worms: Self-replicating programs that spread across a network by exploiting software vulnerabilities, consuming massive amounts of bandwidth and crashing systems.Ransomware: A highly destructive form of malware that encrypts critical network files and demands a financial payout for the decryption key. Modern ransomware variants often target network backups first to prevent organizations from restoring their data for free.Phishing and Social EngineeringWhile network security heavily relies on technical hardware and software, human behavior remains a significant vulnerability. Phishing involves sending fraudulent communications—usually emails—designed to trick employees into revealing network credentials or clicking links that download malware directly onto a corporate machine.Man-in-the-Middle (MitM) AttacksIn a MitM attack, a cybercriminal secretly inserts themselves between two communicating devices (such as a laptop and a corporate server). By tricking the devices into thinking they are speaking directly to each other, the attacker can intercept, view, and alter sensitive information in real time. This frequently occurs on unsecured or public Wi-Fi networks.Denial-of-Service (DoS) and Distributed Denial-of-Service (DDoS)Instead of stealing data, DoS and DDoS attacks aim to destroy availability. Attackers weaponize botnets—large networks of compromised, internet-connected devices—to flood a target network server with an overwhelming volume of fake traffic. The server's processor and memory become maxed out, causing the network to crash or freeze for legitimate users.Advanced Persistent Threats (APTs)APTs are highly targeted, prolonged cyberattacks orchestrated by well-funded groups, such as nation-state actors or organized crime syndicates. Instead of a quick data theft, an APT group sneaks into a network silently and avoids detection for months or years. Their goal is to continuously spy on operations, steal intellectual property, and harvest data over an extended period.3. Core Components of Network Security ArchitectureSecuring a network requires a multi-layered defense strategy, a concept known as Defense-in-Depth. If an attacker breaches the outer layer, subsequent layers are waiting to neutralize the threat.+-------------------------------------------------------+| PERIMETER DEFENSE (Firewalls, Edge Routers) || +---------------------------------------------------+| | NETWORK SEGMENTATION (Internal Subnets, DMZs) || | +-----------------------------------------------+| | | ACCESS CONTROL (IAM, MFA, Least Privilege) || | | +-------------------------------------------+| | | | DATA PROTECTION (Encryption, IDS/IPS) || | +---|-------------------------------------------+| +-------|-------------------------------------------++-----------|-------------------------------------------+ v CRITICAL DATAFirewallsFirewalls serve as the primary border patrol of a network. They monitor incoming and outgoing network traffic based on an established set of security rules.Packet-Filtering Firewalls: Inspect basic data points like source IP addresses, destination IPs, and port numbers to accept or drop traffic.Next-Generation Firewalls (NGFWs): Go beyond basic filtering. They perform deep packet inspection, analyze application-level traffic, and integrate built-in threat intelligence to spot advanced malware signatures.Access Control and Identity ManagementNot every employee needs access to every file on a network. Access control enforces the Principle of Least Privilege (PoLP), which states that users should only have the minimum network access necessary to complete their daily job duties. This is paired with Multi-Factor Authentication (MFA), requiring users to present two or more verification factors (like a password and a smartphone token) before gaining access to the network infrastructure.Intrusion Detection Systems (IDS) and Intrusion Prevention Systems (IPS)IDS and IPS tools continuously monitor network traffic for suspicious patterns or known attack signatures.IDS: Acts as a passive security camera. It analyzes traffic and alerts security administrators if it spots anomalous activity (e.g., an unusual brute-force login attempt).IPS: Acts as an active security guard. It sits directly in the traffic flow and automatically drops connections, blocks IP addresses, or terminates dangerous sessions the moment a threat is identified.Virtual Private Networks (VPNs)With the rise of remote and hybrid work, corporate networks no longer sit entirely inside a single physical office building. A VPN creates an encrypted, secure tunnel over the public internet between a remote user's device and the private corporate network. This ensures that even if an employee connects from a public coffee shop, their corporate data transfers remain completely hidden from interception.Network SegmentationNetwork segmentation involves splitting a large computer network into smaller, isolated subnetworks (zones). For example, a corporation might separate its public-facing guest Wi-Fi, internal finance servers, and building management systems into separate zones. If a hacker compromises a guest Wi-Fi device, network segmentation prevents them from moving laterally into the sensitive finance servers.4. Key Protocols and Encryption in Network SecurityBehind every secure network link lies a framework of cryptographic protocols designed to keep communication lines safe.Secure Sockets Layer (SSL) and Transport Layer Security (TLS) TLS (the modern, secure successor to SSL) is the protocol that powers secure web browsing. It encrypts data traveling between a user’s web browser and a website server. When you see https:// and a padlock icon in your browser's address bar, TLS is actively encrypting your session, protecting credit card details and login credentials from interceptors.IP Security (IPsec)IPsec is a suite of protocols used to secure internet communication at the IP layer. It is most commonly used to set up highly secure site-to-site VPN configurations, allowing branch offices in different parts of the world to share a secure network tunnel over the internet.WPA3 (Wi-Fi Protected Access 3) WPA3 is the latest security protocol for wireless networks. It fixes major cryptographic flaws found in older WPA2 configurations, providing much stronger encryption for wireless data transfers and defending networks against password-guessing dictionary attacks.5. The Paradigm Shift: Moving to Zero Trust ArchitectureFor decades, network security relied heavily on the "Castle-and-Moat" framework. Organizations focused nearly all their resources on building a strong perimeter (the moat) using firewalls. Anyone inside the perimeter was automatically trusted.However, modern cloud environments, mobile devices, and remote workforces have made traditional perimeters obsolete. Furthermore, if an attacker bypasses the firewall using stolen credentials, they gain unfettered access to the entire internal network.To address these flaws, the cybersecurity industry shifted toward a Zero Trust Architecture. The core principle of Zero Trust is simple: Never Trust, Always Verify. [ UNTRUSTED ZONE ] | ( Request to access resource ) v+---------------------------------------------------+| ZERO TRUST GATEWAY || - Explicitly verify identity & MFA || - Check device health & compliance || - Apply Least Privilege access rules |+---------------------------------------------------+ | [ VERIFIED ACCESS ] v [ TARGET RESOURCE ]Under a Zero Trust framework, entry is never granted based on location. Whether a user connects from a desk inside the main office or a home laptop, the system evaluates their identity, device health, and context before authorizing access to a single, isolated application. Trust is continuously verified throughout the entire digital session.6. Best Practices for Implementing Network SecuritySecuring a modern network requires an active, ongoing strategy that combines technology, clear policies, and user education.Conduct Regular Vulnerability Scanning and Penetration Testing: Use automated scanning software to find unpatched software, open ports, and configuration mistakes before attackers do. Supplement this with penetration testing, where white-hat hackers are hired to safely attack your network to expose hidden gaps.Enforce Strict Patch Management: Unpatched operating systems and software applications are a primary entry point for network intrusions. Establish an automated patch cycle to verify, test, and install security updates as soon as vendors release them.Provide Continuous Security Awareness Training: Because technology cannot stop every social engineering attempt, employees must serve as a strong human firewall. Run routine phishing simulations and training sessions so staff can easily spot, flag, and report suspicious messages.Implement Centralized Logging and Monitoring: Deploy a SIEM (Security Information and Event Management) system to aggregate log data from firewalls, routers, and endpoints across your entire network infrastructure. Centralized logs allow security teams to spot complex, multi-stage attacks and respond to security incidents in real time.7. ConclusionNetwork security is no longer an optional add-on for specialized IT teams; it is a fundamental requirement for business continuity, national safety, and individual privacy. As networks grow more complex through cloud integrations and internet-of-things (IoT) devices, the tactics used by threat actors will continue to evolve.By deploying a defense-in-depth architecture, enforcing strict identity management, embracing a Zero Trust mindset, and fostering a culture of cybersecurity awareness, organizations can build resilient networks capable of neutralizing modern threats. In the digital world, network security is the ultimate shield that keeps information moving safely, reliably, and privately across the globe
CloseDealsNG.com: Smart Point-of-Sale and Inventory Automation
Jun 08, 2026
9 min read

CloseDealsNG.com: Smart Point-of-Sale and Inventory Automation

Streamlining Retail Operations: How CloseDealsNG.com Empowers Businesses with Smart Point-of-Sale and Inventory Automation. Managing a retail, wholesale, or multi-location business in today's fast-paced market requires more than just a traditional paper ledger or a basic calculator. Business owners face daily challenges tracking inventory, managing credit sales, overseeing staff across different branches, and maintaining consistent communication with customers. Without centralized control, stock disappears, debt tracking becomes messy, and scaling the business becomes nearly impossible.CloseDealsNG.com is a powerful cloud-based retail management platform and Point-of-Sale (POS) ecosystem designed to solve these exact operational challenges. Built specifically to handle modern commerce workflows, the platform combines inventory management, multi-cashier tracking, debt monitoring, automated billing, and a multi-tier affiliate system into a single, cohesive dashboard.The following sections explore the functional capabilities of CloseDealsNG.com and demonstrate how this platform acts as an operating system for growing businesses.1. Centralised Inventory and Digital Product LoggingAt the heart of the platform is a structured Inventory Log Module that replaces manual stock-taking.[ Product Logging ] ---> [ Central Database ] ---> [ Real-time Availability ]Structured Data EntryShop owners can log products into their secure digital database, capturing critical item details:Stock keeping unit (SKU) attributesCost prices and final selling marginsVariations or product categoriesAutomated Stock AdjustmentsThis layout eliminates blind spots in inventory tracking. When goods arrive, they are instantly recorded in the system. This creates a single source of truth for your stock, protecting your business from manual calculation errors, product loss, and unexplained stock shortages.2. Dynamic Sales Consoles with Live Database IntegrationThe point of transaction is managed by an interactive, database-driven Featured Sales Console. This module serves as the primary workspace for cashiers during checkout.Real-Time Database SyncWhen a cashier selects an item during a live sale, the console pulls current pricing and availability directly from your database.Automated MathAs soon as the transaction is completed, the system automatically subtracts the exact quantity sold from your total stock. This live updates your inventory balances without requiring manual entry or end-of-day stock counts.Overselling ProtectionBy automating stock adjustments at the point of sale, the platform prevents overselling. Owners can monitor exact stock levels in real time from any location, making inventory management efficient and accurate.3. Automated Receipt Generation and Branding ToolsProfessional documentation builds customer trust. CloseDealsNG.com features a built-in Automated Receipt Generator that triggers immediately after every finalized transaction.+------+| CLOSEDEALSNG SHOP || 123 Business Road, Lagos, Nigeria || Tel: +234 800 000 0000 |+---------+| Qty Item Description Price Total || 2 Product Alpha N5,000 N10,000 || 1 Product Beta N3,000 N3,000 |+---------+| Subtotal: N13,000 || VAT (7.5%): N975 || TOTAL PAID: N13,975 |+------------+| Thank you for your business! |+------------+Custom Shop DetailsEvery receipt is automatically customized with the merchant’s specific business metadata, including:Registered business or shop namePhysical store address and contact numbersCustomized footer messages or terms of servicePaperless OptionsThese digital receipts can be printed immediately via thermal point-of-sale printers or issued digitally. This professional touch improves your brand image, guarantees transaction transparency, and gives customers clear, auditable proof of purchase.4. Integrated Debtor Registration During CheckoutIn many retail landscapes, offering customer credit is an essential part of doing business. However, keeping track of who owes what on loose slips of paper often leads to unrecovered losses. CloseDealsNG.com addresses this by embedding a Debtor Recording Framework directly into the checkout workflow.If a customer cannot pay the full amount during checkout, the cashier can flag the transaction as a credit sale. The system records the buyer's details and links the unpaid or partially paid balance directly to their profile.This ensures that partial payments and outstanding accounts are locked into the system at the exact moment of sale, keeping your cash flow records accurate and preventing debt tracking from falling through the cracks.5. Automated WhatsApp Invoice and Receipt DeliveryModern businesses need to meet customers where they already are. CloseDealsNG.com integrates directly with communication infrastructure to offer Automated WhatsApp Invoice Delivery.When a customer provides their phone number during checkout, the platform compiles the transaction details and sends a formatted invoice or receipt directly to their WhatsApp account.[ Transaction Finalized ] ---> [ Trigger API Link ] ---> [ WhatsApp Invoice Received ]This feature provides significant operational advantages:Reduces Paper Costs: Minimizes the need for expensive thermal paper rolls.Instant Customer Record: Gives buyers an immediate, un-losable digital copy of their order history.Direct Communication Open: Establishes a direct, conversational communication line between the shop owner and the client for future marketing or follow-up.6. Multi-Location Multi-Cashier Management ArchitectureFor growing businesses, managing multiple storefronts or branches is a significant challenge. CloseDealsNG.com solves this with a Distributed Cashier Allocation Engine that allows shop owners to manage multiple employees across different physical locations from a single admin account.Owners can create unique login profiles for multiple cashiers. Whether an employee is working at a counter in Lagos, a warehouse in Abuja, or a market stall in Port Harcourt, their individual sales activities flow back to the owner's central dashboard.This multi-tenant setup lets you expand your business footprint without losing oversight, giving you full control over your entire retail network.7. Dynamic VAT Calculator TogglerTax compliance and accurate pricing structures are essential for modern business accounting. The platform includes a built-in VAT Calculator Toggler to simplify tax collection.[ VAT Toggler: OFF ] ---> Core Item Price Only (e.g., N10,000)[ VAT Toggler: ON ] ---> Automated 7.5% Computation (e.g., N10,000 + N750 VAT = N10,750 Total)With a single click, shop owners can turn VAT tracking on or off. When activated, the system automatically calculates the current Value Added Tax (VAT) rate on each item at checkout, adding it to the subtotal and displaying it clearly on the receipt.This automation keeps your business compliant with local tax regulations, removes the need for manual tax calculations, and ensures your financial reporting is accurate and audit-ready.8. Affiliate Marketing Panel with 20% Recurring CommissionTo drive organic growth, CloseDealsNG.com features an integrated Marketer Commission Panel. This affiliate module provides an attractive source of passive income for independent marketers and growth partners.When an individual registers as an affiliate marketer on the platform, they receive a unique tracking link. For every new shop owner they refer who joins the platform, the marketer earns a 20% commission every time that shop owner renews their monthly or annual software subscription.This recurring revenue model creates a win-win system: it helps CloseDealsNG.com expand its community while rewarding marketers with a steady income for introducing businesses to modern automation tools.9. Scalable Subscription Tiers Designed for Every Business SizeCloseDealsNG.com scales alongside your business. The platform offers three distinct subscription tiers tailored to different stages of business growth, ensuring you only pay for the features and capacity you actually need.+-----------------------------------------------------------------------+| SUBSCRIPTION TIERS |+-----------------------------------------------------------------------+| TIER 1 (Micro-Retail) || • Price: 3,000 Naira / Month || • Capacity: 1 Cashier Profile | Maximum 10 Active Products |+-----------------------------------------------------------------------+| TIER 2 (Growing Enterprise) || • Price: 8,000 Naira / Month || • Capacity: 4 Cashier Profiles | Maximum 20 Active Products |+-----------------------------------------------------------------------+| TIER 3 (High-Volume Hub) || • Price: 15,000 Naira / Month || • Capacity: 15 Cashier Profiles | Maximum 50 Active Products |+-----------------------------------------------------------------------+This tiered model makes business automation accessible to everyone. Micro-retailers can start with Tier 1 to organize their initial inventory, while larger, multi-branch businesses can deploy Tier 3 to manage a large workforce and complex distribution setups.10. Centralized Customer and Debtor Management LedgerTo protect your cash flow and keep customer relationships healthy, the platform provides a dedicated Customer Profile and Debt Tracking Ledger.This administrative dashboard gives shop owners a clear view of all credit customers. Instead of searching through old notebooks, owners can open this ledger to view comprehensive debtor profiles, outstanding balances, and transaction dates.When a customer makes a payment, the owner can easily log the amount to update or clear the debt. This structured approach helps speed up collections, prevents disputes, and protects your business's financial health.11. Granular Access Control and Cashier Permission TogglersSecurity is a top priority when delegating tasks to employees. CloseDealsNG.com includes a Cashier Access Permission Toggler to help owners safeguard their business operations.This security feature allows owners to control exactly what their staff can see and do on the platform. With simple dashboard toggles, owners can activate or restrict access to the sales console for individual employees.This access control prevents unauthorized staff from modifying transactions, viewing confidential financial reports, or altering inventory logs, giving you complete peace of mind while delegating daily operations.Technical Summary of Platform FeaturesFunctional Feature ModulePrimary Operational BenefitUser Access TargetInventory Logging ModuleEliminates product shrinkage and tracking errors.Shop Owner / AdminFeatured Sales ConsoleAutomatically adjusts stock balances in real time at checkout.Cashier ProfileAutomated Receipt EngineGenerates branded receipts instantly to build customer trust.End Customer / StaffDebtor Tracking CheckoutRecords outstanding customer credit at the point of sale.Cashier ProfileWhatsApp Invoice GatewayDelivers digital receipts directly to the customer's phone.End Customer GatewayMulti-Location InfrastructureManages multiple employees and branches from one dashboard.Distributed WorkforceVAT Calculator TogglerAutomates tax calculations to simplify accounting.Checkout ModuleMarketer Commission PanelOffers a 20% recurring commission on referral renewals.Affiliate MarketersScalable Subscription ModelProvides flexible pricing tiers that grow with your business.All Registered ShopsCentralized Debt LedgerMonitors and updates outstanding customer balances easily.Shop Owner ControlAccess Permission TogglerSecures sensitive business data by controlling staff access.Owner DashboardConclusion: Transform Your Business Operations TodayCloseDealsNG.com is more than just a standard cash register utility; it is an all-in-one business management ecosystem built for modern commerce. By automating inventory tracking, managing multi-location teams, and organizing credit sales, the platform eliminates the manual stress of running a business.Whether you run a single boutique store or oversee a growing network of retail branches, CloseDealsNG.com provides the tools and visibility you need to streamline your operations, protect your cash flow, and scale your business efficiently.If you are ready to upgrade your business operations, explore the platform and choose your plan at closedealsng.com.Testing App Version on Play Store:https://play.google.com/apps/ internaltest/ 4701619573551008181Youtube Video Clip For Marketer Registrationhttps://youtu.be/UdgDoaE6Fqc

Stay Ahead in Tech

Get the latest ICT tutorials, DevOps guides, and AI news delivered directly to your inbox.