The Latest in

ICT Articles & Tutorials

World ICT News is a professional platform dedicated to Artificial Intelligence, Cloud Computing, DevOps, and Cybersecurity. Empowering the next generation of ICT specialists. Our exclusive tutorials and articles are designed to serve as a stepping stone for you into the world of ICT industry...

Statistics: Skewness and Kurtosis
May 13, 2026
9 min read

Statistics: Skewness and Kurtosis

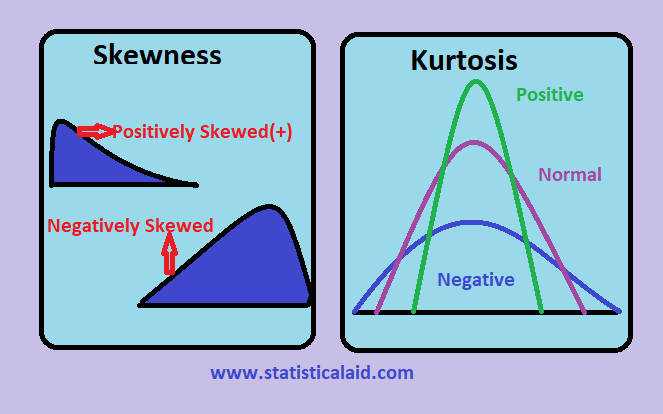
Skewness in Statistics. Skewness is used to determine how asymmetrical a distribution is. It tells you whether your data leans toward one side of the mean or the other.The mean, median, and mode are all equal in a perfectly normal distribution. The curve is symmetrical on both sides. However, most real-world data isn’t perfectly balanced. The values are concentrated at one end, so the tail is pulled towards the other end. Skewness measures that "pull".A skewness value of zero indicates a perfectly symmetric distributionPositive values point to a right-leaning tailNegative values point to a left-leaning tail The further the value moves from zero, the more asymmetric your data is.Skewness is important because it directly affects the interpretation of the mean. In a skewed distribution, the mean is pulled towards the tail, and it no longer accurately represents a typical value. Early awareness of the meaning helps you select appropriate statistical methods and avoid drawing conclusions unsupported by the data.Kurtosis DefinitionAs skewness tells you of the direction of the lean in your data, kurtosis meaning tells you: "how sharp or how flat the peak of your distribution is, and how much the weight lies in the tails."To be more precise, kurtosis is used to understand how many extreme values you have, relative to a normal distribution. A high-peaked, sharp-tailed distribution has very different behavior from a broad and flat one, even if both have the same mean and standard deviation. That difference is captured by kurtosis.The kurtosis value of a normal distribution is 3 and is used as the reference point. Some analysts use excess kurtosis, obtained by subtracting 3 from the raw value, so that the scores of the normal distribution are zero, making comparisons easier to interpret.When kurtosis is high, you are more likely to find extreme values in your dataWhen it is low, the distribution has lighter tails, meaning fewer extreme valuesThis makes kurtosis particularly useful in areas such as finance and risk analysis, where knowing the likelihood of extreme outcomes is not only helpful but necessary.Did you know? Data is typically considered approximately normal only when skewness and excess kurtosis both fall between -1 and +1. (Source: PMC, Descriptive Statistics and Normality Tests)Types of SkewnessThere are three types, and the distinction is straightforward.1. Positive Skewness (Right-Skewed)In a positively skewed (right-skewed) distribution, most values are concentrated on the left side, while the tail extends toward the right. Because of the long right tail, the mean is typically greater than the median, and the median is greater than the mode.In this distribution, Mean > Median > ModeFigure: Positive Skewness2. Negative Skewness (Left-Skewed)In a negatively skewed, or left-skewed, distribution, most data points are concentrated toward the right side, while the tail extends toward the left. Because of this longer left tail, the mean is typically less than the median, and the median is less than the mode.In this distribution, Mode > Median > MeanFigure: Negative Skewness3. Zero Skewness (Symmetric)A perfectly balanced distribution on either side gives a zero skewness. Mean, median, and mode are all equal, and neither tail is heavier than the other. This is the normal distribution in its ideal form.Types of KurtosisKurtosis has three types, based on the value.1. Leptokurtic (Positive Kurtosis)A leptokurtic distribution is one with a kurtosis greater than 3.Leptokurtic (Positive Kurtosis)It has a tall, sharp peak and thick tails; that is, data is extremely concentrated around the mean; however, when extreme values occur, they may be important. There is a higher likelihood of outliers in this type than in the normal distribution.2. Platykurtic (Negative Kurtosis)Platykurtic distributions have a kurtosis value below 3.Platykurtic (Negative Kurtosis)The peak is flatter and wider, and the tails are thinner. Here, the data are more widely distributed, with fewer extreme values. The distribution is nearly stretched compared to a normal curve. A good example of platykurtic behavior is a uniform distribution.3. Mesokurtic (Kurtosis = 3)Mesokurtic KurtosisThis is the baseline, the normal distribution itself. The kurtosis of a mesokurtic distribution is exactly 3, with balanced peaks and tails, which is taken as the reference point for comparing leptokurtic and platykurtic distributions.Did You Know? A 2025 study found that the power and reliability of normality tests vary substantially with skewness and kurtosis, especially in small samples. (Source: Springer Link, BMC Medical Research Methodology, ‘as of Sep 2025’.)Formula for Skewness and KurtosisHaving understood the meaning of skewness and kurtosis in principle, the next step is to learn how to calculate them. The formula for skewness and kurtosis is a direct result of the concepts; both of them represent the shape of a distribution in the form of a number that you can calculate, compare, and operate on.Skewness FormulaPearson's skewness coefficient is the most commonly employed, and it exists in two forms:Pearson's First Coefficient of Skewness = (Mean - Mode)/Standard deviationPearson's Second Coefficient of Skewness = 3(Mean - Median)/Standard deviationWhen the mode is unclear or unstable, as with continuous data, the second coefficient is usually used. The two formulas are used to determine the distance between the mean and the center of the distribution, normalized by the standard deviation, to make the outcome similar across data sets.Interpreting skewness values:-0.5 to 0.5 → Approximately symmetric-1 to -0.5 or 0.5 to 1 → Moderately skewedLess than -1 or greater than 1 → Highly skewedKurtosis FormulaThe kurtosis formula quantifies how steep the peak is and the weight of the tails when compared to a normal distribution:K = [Σ(X - X̄)⁴ / n] / s⁴Where:X = each data pointXˉ= mean of the datasetn = number of data pointss = standard deviationThis gives you the raw kurtosis value, where 3 is the baseline for a normal distribution. Practically, excess kurtosis has often been used by many analysts, which is computed as:Kexcess = K-3This is just a simple re-centering of the scale so that a normal distribution assigns a score of zero, making it easy to quickly determine whether the distribution has heavier or lighter tails than normal.When excess kurtosis is positive, tails are heavier,When it is negative, they are lighter.Difference Between Skewness and KurtosisDimensionSkewnessKurtosisWhat it measuresAsymmetry of the distributionPeakedness and tail weightCore question answeredWhich direction does data lean?How extreme are the tails?Reference value0 (perfectly symmetric)3 (normal distribution)Positive value meansThe right tail is longerSharper peak, heavier tails (Leptokurtic)Negative value meansThe left tail is longerFlatter peak, lighter tails (Platykurtic)Effect on the meanMean is pulled toward the tailMean may remain centered, but outliers increaseTypical use caseDetecting directional bias in dataDetecting outlier-proneness and tail riskReal-world exampleIncome distribution, exam scoresStock market returns, insurance claimsThe key takeaway is that kurtosis and skewness complement each other. Skewness describes the direction of distortion in a distribution, and kurtosis describes the degree to which the distribution's tails extend. Both are required to see the whole picture.Why Skewness and Kurtosis Matter in Statistics?Mean and standard deviation are great starting points; however, they don't give you all the information about your data. What those summary statistics lack is filled in by skewness and kurtosis in statistics.Here's why they matter in practice:They expose when the mean is misleading. The mean in a skewed distribution is pulled towards the tail. When you are making decisions using it, budgeting, performance, and risk estimation, skewness in statistics informs you on whether the mean is actually credible.They reveal outlier risk. High kurtosis indicates heavier tails, meaning extreme values are more likely than a normal distribution would suggest. Many financial models that failed during market downturns did so because they assumed normality and overlooked this entirely.They determine which statistical tests are valid. Tests such as t-tests, ANOVA, and linear regression assume approximate normality. Once skewness or kurtosis deviates significantly, those assumptions fail, and so do your results.They're essential in machine learning. Highly skewed features can distort model training. Checking and correcting skewness before modeling is a standard preprocessing step that directly affects performance.Skewness and Kurtosis Quick Diagnosis ChecklistBefore running any statistical analysis, run through this:Calculate the skewness value:Between -0.5 and 0.5 → proceed normallyBetween ±0.5 and ±1 → consider median over meanBeyond ±1 → apply log or square root transformation before analysisCalculate kurtosis value:Close to 3 (excess ≈ 0) → distribution is normal, proceedAbove 3 → flag for outlier review before modelingBelow 3 → data is spread flat; verify test assumptions still holdFinal Check:If both deviate significantly → avoid t-tests, ANOVA, and standard regression without adjustmentExamples of Skewness and KurtosisReal-world data is rarely textbook-perfect, and these examples of kurtosis and skewness show up across different fields.Income Distribution: Positive SkewnessThe majority of people earn less than the national average, and a small group of very high earners lies much farther to the right in the tail.This pulls the mean upward, rendering it an inaccurate depiction of average income. It's why median income is a more honest benchmark.Exam Scores: Negative SkewnessWhen an exam is straightforward, most students score high and only a few score very low. Data clusters toward the upper end with a long left tail, a clean example of negative skewness that teachers encounter regularly.Stock Market Returns: LeptokurticDaily returns have a small average, though large gains or losses are much more frequent than they would be according to a normal distribution.These include the so-called "fat tails," which are characteristic of high kurtosis and are precisely why conventional risk models tend to underestimate the likelihood of a market crash.Rainfall Data: PlatykurticIn places where seasonal rains occur regularly, there are no peaks or extreme variations in monthly rainfall. This flat, wide distribution is typical platykurtic behavior, with kurtosis below 3 and no surprises at either end.Manufacturing Quality Control: Zero SkewnessA well-functioning production process keeps measurements like component dimensions or fill weights symmetrically centered around a target value. Skewness near zero means the process is on track. Any drift signals something's gone wrong.Key TakeawaysKurtosis and skewness are not limited to the mean; they describe the true shape of a distribution, making them essential for any honest data analysisSkewness tells you which direction your data leans; kurtosis tells you how extreme the tails are. You need both to understand a distribution fullyHigh kurtosis or heavy skewness may invalidate other commonly used statistical tests, making these checks a non-negotiable step before any analysisIn practice, in fields such as finance, healthcare, and machine learning, these two measures are directly involved in decision-making, including risk assessment and model preprocessing
Linear Algebra for Data Science
May 07, 2026
3 min read

Linear Algebra for Data Science

Linear Algebra for Data Science. Linear algebra is the branch of mathematics that deals with vectors, vector spaces, and linear transformations. Linear Algebra in data science offers essential tools for interacting with data in numerous approaches, understanding relationships between variables, performing dimensionality reduction, and solving systems of equations. Linear algebra techniques, including matrix operations and eigenvalue decomposition, are typically used for tasks like regression, clustering, and machine learning algorithms.Importance of Linear Algebra in Data ScienceLinear algebra in data science is important because of its crucial role in numerous sector components.It forms the backbone of machine learning algorithms, enabling operations like matrix multiplication, which are essential to model training and prediction.Linear algebra techniques facilitate dimensionality reduction, enhancing the performance of data processing and interpretation.Eigenvalues and eigenvectors help understand data records variability, influencing clustering and pattern recognition.Solving systems of equations is crucial for optimization tasks and parameter estimation.Furthermore, linear algebra supports image and signal processing strategies critical in data analysis.Proficiency in linear algebra empowers data scientists to successfully represent, control, and extract insights from data, in the end driving the development of accurate models and informed decision-making.Representation of Problems in Linear AlgebraIn linear algebra, problems can frequently be represented and solved using matrices and vectors.Many real-world situations can be translated into linear equations and converted right into a matrix structure.Additionally, problems related to transformations, scaling, rotation, and projection, can be depicted using matrices.Data units can be represented as matrices, in which every row corresponds to an observation and each column corresponds to a characteristic.Eigenvalues and eigenvectors offer insights into dominant patterns and adjustments inside data, assisting in tasks like dimensionality reduction and understanding variability.The usage of matrix operations can solve linear regression problems to discover optimal coefficients.Classification problems can also be tackled using linear algebra strategies like support vector machines, which involve mapping statistics into higher-dimensional spaces.How is Linear Algebra used in Data Science?Linear algebra in data science is considerably used for numerous tasks and strategies:Data Representation: Data sets are often represented as matrices, wherein every row corresponds to an observation and every column represents a function. This matrix illustration permits efficient manipulation and data analysis.Matrix Operations: Basic matrix operations like addition, multiplication, and transposition are used for numerous calculations, such as computing similarity measures, remodeling data, and solving equations.Dimensionality Reduction:  Singular Value Decomposition (SVD) and Principal Component Analysis (PCA) methods rely on principles from linear algebra to decrease the complexity of data while retaining critical information.Linear Regression: Linear algebra is the base of linear regression, a widely used technique for modeling relationships between variables and depicting predictions.Machine Learning Algorithms: Algorithms like support vector machines, linear discriminant evaluation, and logistic regression utilize linear algebra operations to build models and classify information.Image and Signal Processing: Linear algebra strategies are vital in image processing responsibilities like filtering, compression, and edge detection. Fourier transforms, and convolutions contain linear algebra operations as well.Optimization: Linear algebra is important for optimization algorithms utilized in machine learning, including gradient descent, based on calculating gradients.Eigenvalues and Eigenvectors: These concepts assist in identifying dominant patterns and directions of variability in data, useful in clustering, feature extraction, and expert data characteristics.Data Visualization: Dimensionality reduction techniques supplied through linear algebra, such as PCA, help visualize high-dimensional information in low-dimensional areas.Solving Equations: Utilizing linear algebra techniques is a common approach to solving sets of linear equations, which emerge in scenarios involving optimization problems and the estimation of parameters.
Introduction to Data Analysis Techniques
May 06, 2026
13 min read

Introduction to Data Analysis Techniques

Data analysis is an essential aspect of modern decision-making processes across various sectors, including business, healthcare, finance, and academia. As organizations generate massive amounts of data daily, understanding how to extract meaningful insights from this data becomes crucial. In this article, we will explore the fundamental concepts of data analysis, its types, significance, methods, and the tools used for effective analysis. We will also address common queries related to data analysis, providing clarity on its definition and applications in various fields.Table of ContentWhat Do You Mean by Data Analysis?Data Analysis DefinitionData Analysis in Data ScienceData Analysis in DBMSWhy Data Analysis is important?The Process of Data AnalysisAnalyzing Data: Techniques and MethodsWhat Do You Mean by Data Analysis?In today’s data-driven world, organizations rely on data analysis to uncover patterns, trends, and relationships within their data. Whether it’s for optimizing operations, improving customer satisfaction, or forecasting future trends, effective data analysis helps stakeholders make informed decisions. The term data analysis refers to the systematic application of statistical and logical techniques to describe, summarize, and evaluate data. This process can involve transforming raw data into a more understandable format, identifying significant patterns, and drawing conclusions based on the findings.When we ask, “What do you mean by data analysis?” it essentially refers to the practice of examining datasets to draw conclusions about the information they contain. The process can be broken down into several steps, including:Data Collection: Gathering relevant data from various sources, which could be databases, surveys, sensors, or web scraping.Data Cleaning: Identifying and correcting inaccuracies or inconsistencies in the data to ensure its quality and reliability.Data Transformation: Modifying data into a suitable format for analysis, which may involve normalization, aggregation, or creating new variables.Data Analysis: Applying statistical methods and algorithms to explore the data, identify trends, and extract meaningful insights.Data Interpretation: Translating the findings into actionable recommendations or conclusions that inform decision-making.By employing these steps, organizations can transform raw data into a valuable asset that guides strategic planning and enhances operational efficiency.To solidify our understanding, let’s define data analysis with an example. Imagine a retail company looking to improve its sales performance. The company collects data on customer purchases, demographics, and seasonal trends.By conducting a data analysis, the company may discover that:Customers aged 18-25 are more likely to purchase specific products during holiday seasons.There is a significant increase in sales when promotional discounts are offered.Based on these insights, the company can tailor its marketing strategies to target younger customers with specific promotions during peak seasons, ultimately leading to increased sales and customer satisfaction.Data Analysis DefinitionTo further clarify the concept, let’s define data analysis in a more structured manner. Data analysis can be defined as:“The process of inspecting, cleaning, transforming, and modeling data to discover useful information, draw conclusions, and support decision-making.”This definition emphasizes the systematic approach taken in analyzing data, highlighting the importance of not only obtaining insights but also ensuring the integrity and quality of the data used.Data Analysis in Data ScienceThe field of data science relies heavily on data analysis to derive insights from large datasets. Data analysis in data science refers to the methods and processes used to manipulate data, identify trends, and generate predictive models that aid in decision-making.Data scientists employ various analytical techniques, such as:Statistical Analysis: Applying statistical tests to validate hypotheses or understand relationships between variables.Machine Learning: Using algorithms to enable systems to learn from data patterns and make predictions.Data Visualization: Creating graphical representations of data to facilitate understanding and communication of insights.These techniques play a vital role in enabling organizations to leverage their data effectively, ensuring they remain competitive and responsive to market changes.Data Analysis in DBMSAnother area where data analysis plays a crucial role is within Database Management Systems (DBMS). Data analysis in DBMS involves querying and manipulating data stored in databases to extract meaningful insights. Analysts utilize SQL (Structured Query Language) to perform operations such as:Data Retrieval: Extracting specific data from large datasets using queries.Aggregation: Summarizing data to provide insights at a higher level.Filtering: Narrowing down data to focus on specific criteria.Understanding how to perform effective data analysis in DBMS is essential for professionals who work with databases regularly, as it allows them to derive insights that can influence business strategies.Why Data Analysis is important?Data analysis is crucial for informed decision-making, revealing patterns, trends, and insights within datasets. It enhances strategic planning, identifies opportunities and challenges, improves efficiency, and fosters a deeper understanding of complex phenomena across various industries and fields.Informed Decision-Making: Analysis of data provides a basis for informed decision-making by offering insights into past performance, current trends, and potential future outcomes.Business Intelligence: Analyzed data helps organizations gain a competitive edge by identifying market trends, customer preferences, and areas for improvement.Problem Solving: It aids in identifying and solving problems within a system or process by revealing patterns or anomalies that require attention.Performance Evaluation: Analysis of data enables the assessment of performance metrics, allowing organizations to measure success, identify areas for improvement, and set realistic goals.Risk Management: Understanding patterns in data helps in predicting and managing risks, allowing organizations to mitigate potential challenges.Optimizing Processes: Data analysis identifies inefficiencies in processes, allowing for optimization and cost reduction.The Process of Data AnalysisA Data analysis has the ability to transform raw available data into meaningful insights for your business and your decision-making. While there are several different ways of collecting and interpreting this data, most data-analysis processes follow the same six general steps.Define Objectives and Questions: Clearly define the goals of the analysis and the specific questions you aim to answer. Establish a clear understanding of what insights or decisions the analyzed data should inform.Data Collection: Gather relevant data from various sources. Ensure data integrity, quality, and completeness. Organize the data in a format suitable for analysis. There are two types of data: qualititative and quantitative data.Data Cleaning and Preprocessing: Address missing values, handle outliers, and transform the data into a usable format. Cleaning and preprocessing steps are crucial for ensuring the accuracy and reliability of the analysis.Exploratory Data Analysis (EDA): Conduct exploratory analysis to understand the characteristics of the data. Visualize distributions, identify patterns, and calculate summary statistics. EDA helps in formulating hypotheses and refining the analysis approach.Statistical Analysis or Modeling: Apply appropriate statistical methods or modeling techniques to answer the defined questions. This step involves testing hypotheses, building predictive models, or performing any analysis required to derive meaningful insights from the data.Interpretation and Communication: Interpret the results in the context of the original objectives. Communicate findings through reports, visualizations, or presentations. Clearly articulate insights, conclusions, and recommendations based on the analysis to support informed decision-making.Analyzing Data: Techniques and MethodsWhen discussing analyzing data, several methods can be employed depending on the nature of the data and the questions being addressed. These methods can be broadly categorized into three types:There are various data analysis methods, each tailored to specific goals and types of data. The major Data Analysis methods are:1. Descriptive AnalysisA Descriptive Analysis is foundational as it provides the necessary insights into past performance. Understanding what has happened is crucial for making informed decisions in data analysis. For instance, data analysis in data science often begins with descriptive techniques to summarize and visualize data trends.2. Diagnostic AnalysisDiagnostic analysis works hand in hand with Descriptive Analysis. As descriptive Analysis finds out what happened in the past, diagnostic Analysis, on the other hand, finds out why did that happen or what measures were taken at that time, or how frequently it has happened. By analyzing data thoroughly, businesses can address the question, “what do you mean by data analysis?” They can assess what factors contributed to specific outcomes, providing a clearer picture of their operational efficiency and effectiveness.3. Predictive AnalysisBy forecasting future trends based on historical data, Predictive analysis predictive analysis enables organizations to prepare for upcoming opportunities and challenges. This analysis type answers the inquiry of what is data science analysis by leveraging data trends to predict future behaviors and trends. This capability is vital for strategic planning and risk management in business operations.4. Prescriptive AnalysisPrescriptive Analysis is an advanced method that takes Predictive Analysis insights and offers actionable recommendations, guiding decision-makers toward the best course of action. It extends beyond merely analyzing data to suggesting optimal solutions based on potential future scenarios, thus addressing the need for a structured approach to decision-making.5. Statistical AnalysisStatistical Analysis is essential for summarizing data, helping in identifying key characteristics and understanding relationships within datasets. This analysis can reveal significant patterns that inform broader strategies and policies, thereby allowing analysts to provide a robust review of data analytics practices within an organization.6. Regression AnalysisRegression analysis is a statistical method extensively used in data analysis to model the relationship between a dependent variable and one or more independent variables. This method is particularly useful in establishing the relationship between variables, making it vital for forecasting and strategic planning, as analysts often define data analysis with examples that utilize regression techniques to illustrate these concepts.7. Cohort AnalysisBy examining specific groups over time, cohort analysis aids in understanding customer behavior and improving retention strategies. This approach allows businesses to tailor their services to different segments, thereby effectively utilizing data storage and analysis in big data to enhance customer engagement and satisfaction.8. Time Series AnalysisTime series analysis is crucial for any domain where data points are collected over time, allowing for trend identification and forecasting. Businesses can utilize this method to analyze seasonal trends and predict future sales, addressing the question of what do you understand by data analysis in the context of temporal data.9. Factor AnalysisFactor analysis is a statistical method that explores underlying relationships among a set of observed variables. It identifies latent factors that contribute to observed patterns, simplifying complex data structures. This technique is invaluable in reducing dimensionality, revealing hidden patterns, and aiding in the interpretation of large datasets.10. Text AnalysisText analysis involves extracting valuable information from unstructured textual data. Utilizing natural language processing and machine learning techniques, it enables the extraction of sentiments, key themes, and patterns within large volumes of text. analyze customer feedback, social media sentiment, and more, showcasing the practical applications of analyzing data in real-world scenarios.Tools for Data AnalysisSeveral tools are available to facilitate effective data analysis. These tools can range from simple spreadsheet applications to complex statistical software. Some popular tools include:SAS :SAS was a programming language developed by the SAS Institute for performed advanced analytics, multivariate analyses, business intelligence, data management, and predictive analytics. , SAS was developed for very specific uses and powerful tools are not added every day to the extensive already existing collection thus making it less scalable for certain applications.Microsoft Excel :It is an important spreadsheet application that can be useful for recording expenses, charting data, and performing easy manipulation and lookup and or generating pivot tables to provide the desired summarized reports of large datasets that contain significant data findings. It is written in C#, C++, and .NET Framework, and its stable version was released in 2016.R :It is one of the leading programming languages for performing complex statistical computations and graphics. It is a free and open-source language that can be run on various UNIX platforms, Windows, and macOS. It also has a command-line interface that is easy to use. However, it is tough to learn especially for people who do not have prior knowledge about programming.Python: It is a powerful high-level programming language that is used for general-purpose programming. Python supports both structured and functional programming methods. Its extensive collection of libraries make it very useful in data analysis. Knowledge of Tensorflow, Theano, Keras, Matplotlib, Scikit-learn, and Keras can get you a lot closer to your dream of becoming a machine learning engineer.Tableau Public: Tableau Public is free software developed by the public company “Tableau Software” that allows users to connect to any spreadsheet or file and create interactive data visualizations. It can also be used to create maps, dashboards along with real-time updation for easy presentation on the web. The results can be shared through social media sites or directly with the client making it very convenient to use.Knime :Knime, the Konstanz Information Miner is a free and open-source data analytics software. It is also used as a reporting and integration platform. It involves the integration of various components for Machine Learning and data mining through the modular data-pipe lining. It is written in Java and developed by KNIME.com AG. It can be operated in various operating systems such as Linux, OS X, and Windows.Power BI: A business analytics service that provides interactive visualizations and business intelligence capabilities with a simple interface.ConclusionIn conclusion, data analysis is a vital process that involves examining, cleaning, transforming, and modeling data to extract meaningful insights that drive decision-making. With the vast amounts of data generated daily, organizations must harness the power of data analysis to remain competitive and responsive to market trends.Understanding the different types of data analysis, the tools available, and the methods employed in this field is essential for professionals aiming to leverage data effectively. As we move further into the digital age, the significance of data analysis will continue to grow, shaping the future of industries and influencing strategic decisions across the globe.Data Analysis- FAQsWhat is the definition of data analysis in data science?The define data analysis in data science refers to the methodology of collecting, processing, and analyzing data to generate insights and support data-driven decisions within the field of data science.What is Data Analysis Examples?To define data analysis with an example, consider a retail company analyzing sales data to identify trends in customer purchasing behavior. This can involve descriptive analysis to summarize past sales and predictive analysis to forecast future trends based on historical data.How to do data analysis in Excel?Import data into Excel, use functions for summarizing and visualizing data. Utilize PivotTables, charts, and Excel’s built-in analysis tools for insights and trends.How does data storage and analysis work in big data?Data storage and analysis in big data involves utilizing technologies that manage and analyze vast amounts of structured and unstructured data. This enables organizations to derive meaningful insights from large datasets, driving strategic decision-making.What is computer data analysis?Computer data analysis refers to the use of computer software and algorithms to perform data analysis. This method streamlines the process, allowing for efficient handling of large datasets and complex analyses.Where can I find a review of data analytics?A review of data analytics can be found on various platforms, including academic journals, industry reports, and websites like Geeks for Geeks that provide comprehensive insights into data analytics practices and technologies.What are the benefits of data analysis?The benefits of data analysis include improved decision-making, enhanced operational efficiency, better customer insights, and the ability to identify market trends. Organizations that leverage data analysis gain a competitive advantage by making informed choices.
Data Analysis
Apr 29, 2026
3 min read

Data Analysis

Data Analysis Definition and Techniques. Data analysis is the practice of working with data to deduce useful information, which can then be used to make informed decisions.Companies are wisening up to the benefits of leveraging data. Data analysis can help a bank to personalize customer interactions, a health care system to predict future health needs, or an entertainment company to create the next big streaming hit.Data Analysis ProcessesAs the data available to companies continues to grow both in amount and complexity, so too does the need for an effective and efficient process by which to harness the value of that data. The data analysis process typically moves through several iterative phases.Identify the business question you’d like to answer. What problem is the company trying to solve? What do you need to measure, and how will you measure it?Collect the raw data sets you’ll need to help you answer the identified question. Data collection might come from internal sources, like a company’s client relationship management (CRM) software, or from secondary sources, like government records or social media application programming interfaces (APIs).Clean the data to prepare it for analysis. This often involves purging duplicate and anomalous data, reconciling inconsistencies, standardizing data structure and format, and dealing with white spaces and other syntax errors.Analyze the data. By manipulating the data using various data analysis techniques and tools, you can begin to find trends, correlations, outliers, and variations that tell a story. During this stage, you might use data mining to discover patterns within databases or data visualization software to help transform data into an easy-to-understand graphical format.Interpret the results of your analysis to see how well the data answered your original question. What recommendations can you make based on the data? What are the limitations to your conclusions?Act: Use the final insights to implement solutions or optimize business strategies.The 4 Types of Data AnalysisAnalytic approaches are typically categorized by the specific question they aim to answer:Descriptive (What happened?): Summarizes historical data using charts and dashboards to show past performance, such as last month's sales.Diagnostic (Why did it happen?): Digs deeper into data to find the root causes of trends or anomalies.Predictive (What might happen?): Uses statistical models and machine learning to forecast future outcomes, like seasonal demand.Prescriptive (What should we do?): Recommends specific actions to achieve the best possible result based on prior insightsData Analysis vs. Data ScienceWhile related, these fields differ in scope and focus:Data Analysis is generally more task-focused, using existing structured data to answer specific business questions and explain the past.Data Science is broader, often involving heavy coding and complex algorithms to build new models that predict the future or automate decision-making.Vsasf Tech ICT Academy, Enugu offers a comprehensive training in Data Analysis for individuals interested in technical approaches in analysing dataRegister course
Introduction to Data Science
Apr 29, 2026
14 min read

Introduction to Data Science

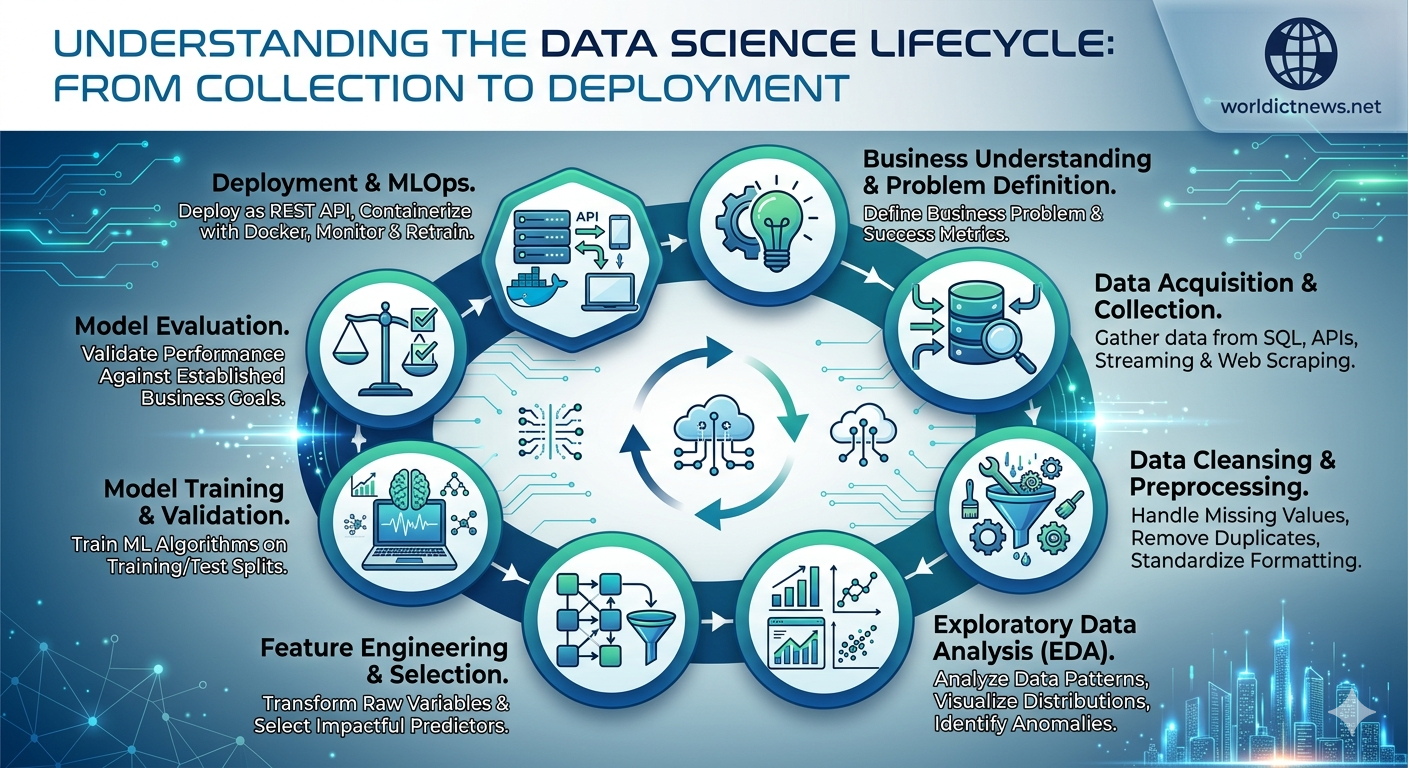
Data Science: Lifecycle, Applications and Prerequisites. Introduction Data science is an essential part of many industries today, given the massive amounts of data that are produced, and is one of the most debated topics in IT circles. Its popularity has grown over the years, and companies have started implementing data science techniques to grow their business and increase customer satisfaction. In this article, we’ll learn what is data science, its applications, and how you can become a data scientist.What Is Data Science?Data science is the domain of study that deals with vast volumes of data using modern tools and techniques, including essential data science skills, to find unseen patterns, derive meaningful information, and make business decisions. Data science uses complex machine learning algorithms to build predictive models. The data used for analysis can come from many different sources and presented in various formats.The Data Science LifecycleNow that you know what is data science, next up let us focus on the data science lifecycle. Data science’s lifecycle consists of five distinct stages, each with its own tasks:Capture: Data Acquisition, Data Entry, Signal Reception, Data Extraction. This stage involves gathering raw structured and unstructured data.Maintain: Data Warehousing, Data Cleansing, Data Staging, Data Processing, Data Architecture. This stage covers taking the raw data and putting it in a form that can be used.Process: Data Mining, Clustering/Classification, Data Modeling, Data Summarization. Data scientists take the prepared data and examine its patterns, ranges, and biases to determine how useful it will be in predictive analysis.Analyze: Exploratory/Confirmatory, Predictive Analysis, Regression, Text Mining, Qualitative Analysis. Here is the real meat of the lifecycle. This stage involves performing the various analyses on the data.Communicate: Data Reporting, Data Visualization, Business Intelligence, Decision Making. In this final step, analysts prepare the analyses in easily readable forms such as charts, graphs, and reports.Data Science PrerequisitesHere are some of the technical concepts you should know about before starting to learn what is data science.1. Machine Learning: Machine learning is the backbone of data science. Data Scientists need to have a solid grasp of ML in addition to basic knowledge of statistics.2. Modeling: Mathematical models enable you to make quick calculations and predictions based on what you already know about the data. Modeling is also a part of Machine Learning and involves identifying which algorithm is the most suitable to solve a given problem and how to train these models.3. Statistics: Statistics are at the core of data science. A sturdy handle on statistics can help you extract more intelligence and obtain more meaningful results.4. Programming: Some level of programming is required to execute a successful data science project. The most common programming languages are Python, and R. Python is especially popular because it’s easy to learn, and it supports multiple libraries for data science and ML.5. Database: A capable data scientist needs to understand how databases work, how to manage them, and how to extract data from them.Who Oversees the Data Science Process?1. Business ManagersThe business managers are the people in charge of overseeing the data science training method. Their primary responsibility is to collaborate with the data science team to characterise the problem and establish an analytical method. A data scientist may oversee the marketing, finance, or sales department, and report to an executive in charge of the department. Their goal is to ensure projects are completed on time by collaborating closely with data scientists and IT managers.2. IT ManagersFollowing them are the IT managers. If the member has been with the organisation for a long time, the responsibilities will undoubtedly be more important than any others. They are primarily responsible for developing the infrastructure and architecture to enable data science activities. Data science teams are constantly monitored and resourced accordingly to ensure that they operate efficiently and safely. They may also be in charge of creating and maintaining IT environments for data science teams.3. Data Science ManagersThe data science managers make up the final section of the tea. They primarily trace and supervise the working procedures of all data science team members. They also manage and keep track of the day-to-day activities of the three data science teams. They are team builders who can blend project planning and monitoring with team growth.What is a Data Scientist?If learning what is data science sounded interesting, understanding what does this job roles is all about will me much more interesting to you. Data scientists are among the most recent analytical data professionals who have the technical ability to handle complicated issues as well as the desire to investigate what questions need to be answered. They're a mix of mathematicians, computer scientists, and trend forecasters. They're also in high demand and well-paid because they work in both the business and IT sectors. On a daily basis, a data scientist may do the following tasks:Discover patterns and trends in datasets to get insightsCreate forecasting algorithms and data modelsImprove the quality of data or product offerings by utilising machine learning techniquesDistribute suggestions to other teams and top managementIn data analysis, use data tools such as R, SAS, Python, or SQLTop the field of data science innovationsWhat Does a Data Scientist Do?You know what is data science, and you must be wondering what exactly is this job role like - here's the answer. A data scientist analyzes business data to extract meaningful insights. In other words, a data scientist solves business problems through a series of steps, including:Before tackling the data collection and analysis, the data scientist determines the problem by asking the right questions and gaining understanding.The data scientist then determines the correct set of variables and data sets.The data scientist gathers structured and unstructured data from many disparate sources—enterprise data, public data, etc.Once the data is collected, the data scientist processes the raw data and converts it into a format suitable for analysis. This involves cleaning and validating the data to guarantee uniformity, completeness, and accuracy.After the data has been rendered into a usable form, it’s fed into the analytic system—ML algorithm or a statistical model. This is where the data scientists analyze and identify patterns and trends.When the data has been completely rendered, the data scientist interprets the data to find opportunities and solutions.The data scientists finish the task by preparing the results and insights to share with the appropriate stakeholders and communicating the results.Why Become a Data Scientist?You learnt what is data science. Did it sound exciting? Here's another solid reason why you should pursue data science as your work-field. According to Glassdoor and Forbes, demand for data scientists will increase by 28 percent by 2026, which speaks of the profession’s durability and longevity, so if you want a secure career, data science offers you that chance. So, if you’re looking for an exciting career that offers stability and generous compensation, then look no further!Uses of Data ScienceData science may detect patterns in seemingly unstructured or unconnected data, allowing conclusions and predictions to be made.Tech businesses that acquire user data can utilise strategies to transform that data into valuable or profitable information.Data Science has also made inroads into the transportation industry, such as with driverless cars. It is simple to lower the number of accidents with the use of driverless cars. For example, with driverless cars, training data is supplied to the algorithm, and the data is examined using data Science approaches, such as the speed limit on the highway, busy streets, etc.Data Science applications provide a better level of therapeutic customisation through genetics and genomics research.Where Do You Fit in Data Science?Now that you know the uses of Data Science and what is data science in general, let's see all the opportunity that this feild offers to focus on and specialize in one aspect of the field. Here’s a sample of different ways you can fit into this exciting, fast-growing field.Data ScientistJob role: Determine what the problem is, what questions need answers, and where to find the data. Also, they mine, clean, and present the relevant data.Skills needed: Programming skills (SAS, R, Python), storytelling and data visualization, statistical and mathematical skills, knowledge of Hadoop, SQL, and Machine Learning.Data AnalystJob role: Analysts bridge the gap between the data scientists and the business analysts, organizing and analyzing data to answer the questions the organization poses. They take the technical analyses and turn them into qualitative action items.Skills needed: Statistical and mathematical skills, programming skills (SAS, R, Python), plus experience in data wrangling and data visualization.Data EngineerJob role: Data engineers focus on developing, deploying, managing, and optimizing the organization’s data infrastructure and data pipelines. Engineers support data scientists by helping to transfer and transform data for queries.Skills needed: NoSQL databases (e.g., MongoDB, Cassandra DB), programming languages such as Java and Scala, and frameworks (Apache Hadoop).Applications of Data ScienceThere are various applications of data science, including:1. HealthcareHealthcare companies are using data science to build sophisticated medical instruments to detect and cure diseases.2. GamingVideo and computer games are now being created with the help of data science and that has taken the gaming experience to the next level.3. Image RecognitionIdentifying patterns is one of the most commonly known applications of data science. in images and detecting objects in an image is one of the most popular data science applications.4. Recommendation SystemsNext up in the data science applications list comes Recommendation Systems. Netflix and Amazon give movie and product recommendations based on what you like to watch, purchase, or browse on their platforms.5. LogisticsData Science is used by logistics companies to optimize routes to ensure faster delivery of products and increase operational efficiency.6. Fraud DetectionFraud detection comes the next in the list of applications of data science. Banking and financial institutions use data science and related algorithms to detect fraudulent transactions.7. Internet SearchInternet comes the next in the list of applications of data science. When we think of search, we immediately think of Google. Right? However, there are other search engines, such as Yahoo, Duckduckgo, Bing, AOL, Ask, and others, that employ data science algorithms to offer the best results for our searched query in a matter of seconds. Given that Google handles more than 20 petabytes of data per day. Google would not be the 'Google' we know today if data science did not exist.8. Speech recognitionSpeech recognition is one of the most commonly known applications of data science. It is a technology that enables a computer to recognize and transcribe spoken language into text. It has a wide range of applications, from virtual assistants and voice-controlled devices to automated customer service systems and transcription services.9. Targeted AdvertisingIf you thought Search was the most essential data science use, consider this: the whole digital marketing spectrum. From display banners on various websites to digital billboards at airports, data science algorithms are utilised to identify almost anything. This is why digital advertisements have a far higher CTR (Call-Through Rate) than traditional marketing. They can be customised based on a user's prior behaviour. That is why you may see adverts for Data Science Training Programs while another person sees an advertisement for clothes in the same region at the same time.10. Airline Route PlanningNext up in the data science and its applications list comes route planning. As a result of data science, it is easier to predict flight delays for the airline industry, which is helping it grow. It also helps to determine whether to land immediately at the destination or to make a stop in between, such as a flight from Delhi to the United States of America or to stop in between and then arrive at the destination.11. Augmented RealityLast but not least, the final data science applications appear to be the most fascinating in the future. Yes, we are discussing something other than augmented reality. Do you realise there's a fascinating relationship between data science and virtual reality? A virtual reality headset incorporates computer expertise, algorithms, and data to create the greatest viewing experience possible. The popular game Pokemon GO is a minor step in that direction. The ability to wander about and look at Pokemon on walls, streets, and other non-existent surfaces. The makers of this game chose the locations of the Pokemon and gyms using data from Ingress, the previous app from the same business.Example of Data ScienceHere are some brief example of data science showing data science’s versatility.Law Enforcement: In this scenario, data science is used to help police in Belgium to better understand where and when to deploy personnel to prevent crime. With only limited resources and a large area to cover data science used dashboards and reports to increase the officers’ situational awareness, allowing a police force that’s spread thin to maintain order and anticipate criminal activity.Pandemic Fighting: The state of Rhode Island wanted to reopen schools, but was naturally cautious, considering the ongoing COVID-19 pandemic. The state used data science to expedite case investigations and contact tracing, enabling a small staff to handle an overwhelming number of concerned calls from citizens. This information helped the state set up a call center and coordinate preventative measures.Challenges of a Data ScientistSome of the common challenges that a data scientist faces, include:Handling large and messy datasets that require cleaning and organization.Selecting the right tools and techniques for analysis.Ensuring accurate and unbiased results.Communicating complex findings to non-technical stakeholders.Aligning data projects with business goals.Keeping up with rapidly evolving technologies.Managing data privacy and security concerns.Data Science vs Business IntelligenceData Science and Business Intelligence (BI) are both data-driven fields but differ in focus and approach. Data Science emphasizes predictive and prescriptive analytics, using advanced techniques like machine learning and AI to forecast trends and provide actionable recommendations. It deals with raw, unstructured, and large datasets to solve complex problems and discover new opportunities.On the other hand, Business Intelligence focuses on descriptive analytics, analyzing structured data from databases to generate reports, KPIs, and dashboards that summarize past and present performance. While Data Science is exploratory and future-oriented, BI is analytical and operational, helping business managers and executives make informed decisions based on historical data insights.FAQs1. What is data science in simple words?Data science, in simple words, is the field of study that involves collecting, analyzing, and interpreting large sets of data to uncover insights, patterns, and trends that can be used to make informed decisions and solve real-world problems.2. What is data science used for?Data science is used for a wide range of applications, including predictive analytics, machine learning, data visualization, recommendation systems, fraud detection, sentiment analysis, and decision-making in various industries like healthcare, finance, marketing, and technology.3. What’s the difference between data science, artificial intelligence, and machine learning?Artificial Intelligence makes a computer act/think like a human. Data science is an AI subset that deals with data methods, scientific analysis, and statistics, all used to gain insight and meaning from data. Machine learning is a subset of AI that teaches computers to learn things from provided data.4. What does a data scientist do?A data scientist analyzes business data to extract meaningful insights.5. What kinds of problems do data scientists solve?Data scientists solve issues like:Loan risk mitigationPandemic trajectories and contagion patternsEffectiveness of various types of online advertisementResource allocation6. Do data scientists code?Sometimes they may be called upon to do so.7. What is the data science course eligibility?If you wish to know anything about our data science course, please check out Data Science Bootcamp and Data Science master’s program.8. Can I learn data science on my own?Data science is a complex field with many difficult technical requirements. It’s not advisable to try learning data science without the help of a structured learning program.

Stay Ahead in Tech

Get the latest ICT tutorials, DevOps guides, and AI news delivered directly to your inbox.